Test Bank for Modern Labor Economics: Theory and Public Policy, 13th Edition

Preview Extract
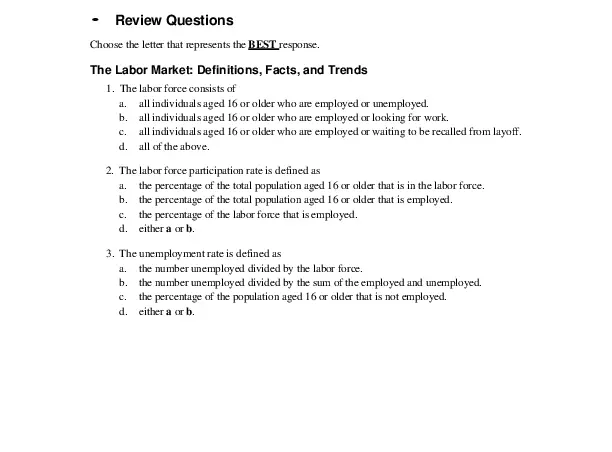
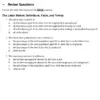
โ€ข Review Questions Choose the letter that represents the BEST response. The Labor Market: Definitions, Facts, and Trends 1. The labor force consists of a. all individuals aged 16 or older who are employed or unemployed. b. all individuals aged 16 or older who are employed or looking for work. c. all individuals aged 16 or older who are employed or waiting to be recalled from layoff. d. all of the above. 2. The labor force participation rate is defined as a. the percentage of the total population aged 16 or older that is in the labor force. b. the percentage of the total population aged 16 or older that is employed. c. the percentage of the labor force that is employed. d. either a or b. 3. The unemployment rate is defined as a. the number unemployed divided by the labor force. b. the number unemployed divided by the sum of the employed and unemployed. c. the percentage of the population aged 16 or older that is not employed. d. either a or b. 24 Ehrenberg/Smith โ€ข Modern Labor Economics: Theory and Public Policy, Thirteenth Edition In answering Questions 4โ€“6, please refer to the information in Table 2-4. Table 2-4 Year Average Nominal Wage Consumer Price Index 1990 1996 $ 9.54 $11.18 100 127 4. Assuming 1990 is the base year, what would the index of nominal wages be for 1996? a. 85 b. 92 c. 117 d. 164 5. Assuming 1990 is the base year, what would the index of real wages be for 1996? a. 67 b. 92 c. 109 d. 117 6. What was the percentage change in real wages over the period 1990 to 1996? a. โˆ’10% b. โˆ’8% c. 9% d. 17% 7. When the real wage of a worker falls, one cannot necessarily conclude that the real income of the worker has also fallen because a. total earnings equal the wage rate times the number of hours worked. b. total compensation includes employee benefits provided by the firm. c. total income includes unearned income such as interest, dividends, and transfer payments. d. all of the above. How the Labor Market Works In answering Questions 8โ€“19, please refer to Figure 2-4. Suppose that the curves labeled D and S in Figure 2-4 represent the long-run market demand and supply curves for construction workers in Boston, Massachusetts, during the summer of 2004. Figure 2-4 Chapter 2 Overview of the Labor Market The Demand for Labor 8. The curve labeled D shows the number of workers firms wish to hire at each wage assuming a. the prices charged by construction firms for homes, office buildings, road construction, etc., remain constant. b. the price of construction equipment remains constant. c. the supply of construction workers remains constant. d. both a and b. 9. An economic reason why the curve labeled D slopes downward in the long run is that a. as wages increase, the firm will substitute equipment for workers. b. as wages increase, the optimal level of output for the firm will decrease. c. as wages increase, the number of workers the firm wishes to hire will decrease. d. both a and b. 10. An algebraic expression consistent with the demand curve in Figure 2-4 would be a. L = 12 โˆ’ (1/3)W. b. W = 36 โˆ’ 3L. c. L = 12 โˆ’ 3W. d. both a and b. 11. The demand curve in Figure 2-4 would shift to the right if a. the market clearing wage fell. b. more workers are accepted into unions representing construction workers. c. the price of construction equipment rises and the substitution effect dominates the scale effect. d. all of the above. The Supply of Labor 12. The curve labeled S in Figure 2-4 shows the number of workers willing to work in construction at each wage assuming a. wages in other occupations are less than in construction. b. working conditions are held constant. c. there is no union. d. all of the above. 13. An algebraic expression consistent with the supply curve in Figure 2-4 would be a. L = 3 โˆ’ 0.5W. b. W = 6 + 2L. c. L = โˆ’2 + (1/3)W. d. both a and b. 14. Assuming all construction jobs offer comparable working conditions, the supply curve facing an individual construction firm will be a. a vertical line. b. a horizontal line at a wage of $18. c. the same as the market supply curve. d. flatter than the market supply curve. 25 26 Ehrenberg/Smith โ€ข Modern Labor Economics: Theory and Public Policy, Thirteenth Edition Determination of the Wage and Employment Level 15. At the market clearing wage a. the quantity demanded equals the quantity supplied. b. no shortages or surpluses exist. c. it is impossible to make someone better off without making someone else worse off. d. all of the above. 16. At the market clearing wage, the total economic rent earned by all the workers employed would be a. $0. b. $36,000. c. $90,000. d. $108,000. 17. Suppose a union represents all construction workers and the union achieves a collective bargaining agreement with employers that specifies a wage of $24. If the firm still chooses what number of workers to hire given the negotiated wage, the result of the collective bargaining agreement will be a. the supply curve of workers will become a vertical line located at an employment level of 4,000 workers. b. there will be a surplus of 2,000 construction workers. c. only 4,000 construction workers will be employed. d. all of the above. 18. If demand increases while supply is constant a. a shortage will exist at the original equilibrium wage. b. the equilibrium wage will increase. c. the wage will rise, causing labor demand to decrease to its original position. d. both a and b. 19. If supply and demand both increase a. the market clearing wage will rise but employment will stay the same. b. employment will rise but the market wage may rise, fall, or stay the same. c. both employment and the market clearing wage will rise. d. there will be no change in the equilibrium. 20. If demand and supply are represented by the equations 1 Demand: LD = 13 โˆ’ W , 3 1 Supply: LS = W โˆ’ 2, 2 then the equilibrium wage (W * ) and employment level (L* ) will equal a. W * = $18, L* = 6. b. W * = $18, L* = 7. c. W * = $16, L* = 8. d. W * = $12, L* = 4. Chapter 2 โ€ข Overview of the Labor Market 27 Problems The Labor Market: Definitions, Facts, and Trends 21. Suppose that the population aged 16 or over in the United States could be categorized as follows Not in the labor force (N) = 75 million, Employed (E) = 115 million, Unemployed (U) = 10 million. 21a. Compute the unemployment rate for this economy. 21b. By historical standards, would your answer to 21a represent a relatively high level of unemployment? 21c. What has been the general trend in the unemployment rate since 1950? 21d. Compute the labor force participation rate for this economy. 21e. By historical standards, would your answer to 21d represent a relatively high labor force participation rate? 21f. What has been the general trend in the labor force participation rate in the United States since 1950? Has the trend been the same for men as it has been for women? 21g. What has been the general trend since 1950 in the type of work Americans perform? 22. Consider Table 2-2 from Example 1 in the Summary section. 22a. What is the rationale behind computing an index of real wages? The Demand and Supply Model 23. Suppose labor demand and supply are represented by the equations Demand: LD = 10 โˆ’ 0.5W, Supply: LS = 0.5W. 23a. Find the equilibrium wage and employment level. 23b. Graph the curves and indicate the equilibrium on the graph. 23c. Explain why $6 cannot be the market clearing wage. 28 Ehrenberg/Smith โ€ข Modern Labor Economics: Theory and Public Policy, Thirteenth Edition *23d. Suppose 3 workers are hired at a wage of $6. Give an example of a mutually beneficial exchange that can still take place. Indicate the economic rent that is generated by your transaction. 23e. If workers earn economic rent, does that mean they are being overpaid? *23f. Suppose all hiring in this market must be done through a union and the union has limited the supply of labor to 4 units. What wage will emerge in this market? How much economic rent have the employed members of the union gained? How much economic rent has been lost due to the limitation on union labor? 23g. Give an example of one thing that might cause labor demand to increase. Also give an example of one thing that might cause labor supply to decrease.

Document Preview (6 of 230 Pages)

User generated content is uploaded by users for the purposes of learning and should be used following SchloarOn's honor code & terms of service.
You are viewing preview pages of the document. Purchase to get full access instantly.

Shop by Category See All


Shopping Cart (0)

Your bag is empty

Don't miss out on great deals! Start shopping or Sign in to view products added.

Shop What's New Sign in