Test Bank for Gordis Epidemiology, 6th Edition

Preview Extract
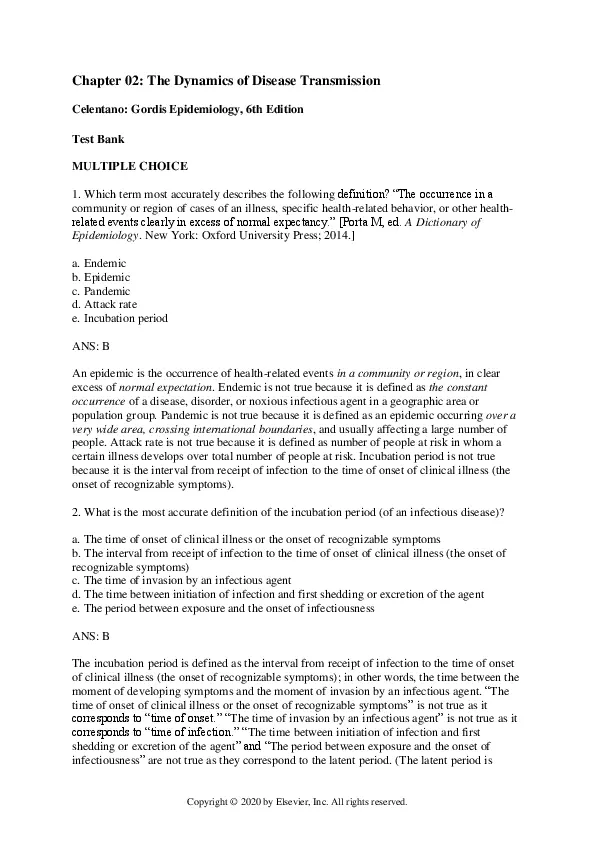
Chapter 02: The Dynamics of Disease Transmission Celentano: Gordis Epidemiology, 6th Edition Test Bank MULTIPLE CHOICE 1. Which term most accurately describes the following definition? โ€œThe occurrence in a community or region of cases of an illness, specific health-related behavior, or other healthrelated events clearly in excess of normal expectancy.โ€ [Porta M, ed. A Dictionary of Epidemiology. New York: Oxford University Press; 2014.] a. Endemic b. Epidemic c. Pandemic d. Attack rate e. Incubation period ANS: B An epidemic is the occurrence of health-related events in a community or region, in clear excess of normal expectation. Endemic is not true because it is defined as the constant occurrence of a disease, disorder, or noxious infectious agent in a geographic area or population group. Pandemic is not true because it is defined as an epidemic occurring over a very wide area, crossing international boundaries, and usually affecting a large number of people. Attack rate is not true because it is defined as number of people at risk in whom a certain illness develops over total number of people at risk. Incubation period is not true because it is the interval from receipt of infection to the time of onset of clinical illness (the onset of recognizable symptoms). 2. What is the most accurate definition of the incubation period (of an infectious disease)? a. The time of onset of clinical illness or the onset of recognizable symptoms b. The interval from receipt of infection to the time of onset of clinical illness (the onset of recognizable symptoms) c. The time of invasion by an infectious agent d. The time between initiation of infection and first shedding or excretion of the agent e. The period between exposure and the onset of infectiousness ANS: B The incubation period is defined as the interval from receipt of infection to the time of onset of clinical illness (the onset of recognizable symptoms); in other words, the time between the moment of developing symptoms and the moment of invasion by an infectious agent. โ€œThe time of onset of clinical illness or the onset of recognizable symptomsโ€ is not true as it corresponds to โ€œtime of onset.โ€ โ€œThe time of invasion by an infectious agentโ€ is not true as it corresponds to โ€œtime of infection.โ€ โ€œThe time between initiation of infection and first shedding or excretion of the agentโ€ and โ€œThe period between exposure and the onset of infectiousnessโ€ are not true as they correspond to the latent period. (The latent period is Copyright ยฉ 2020 by Elsevier, Inc. All rights reserved. Test Bank 2-2 focusing on the onset of infectiousness, but the incubation period is focusing on the onset of the symptom.) 3. There was a food poisoning outbreak on April 1, 2018, at the City Z Food Safety Conference. There were 1,000 people registered for the conference with luncheon, 100 volunteers to host attendees, and 50 people who served the luncheon during the conference. Except for 50 people who served the food, all of the participants and volunteers ate the food from the luncheon at the conference on April 1, 2018. Based only on the information given in this question, how many people are at risk in this food poisoning outbreak? a. 1,000 b. 1,100 c. 1,150 d. 150 e. 50 ANS: B People at risk in this outbreak are people who were exposed to the food at the conference. Even though 1,150 people were at the conference, 50 people who served the food did not eat the food. Therefore we have to exclude those 50 people. 4. There was a food poisoning outbreak on April 1, 2018, at the City Z Food Safety Conference. There were 1,000 people registered for the conference with luncheon, 100 volunteers to host attendees, and 50 people who served the luncheon during the conference. Except for 50 people who served the food, all of the participants and volunteers ate the food from the luncheon at the conference on April 1, 2018. After an initial outbreak of food poisoning is reported, an epidemiologist sends surveys to all people at risk to investigate the cause. However, only 900 people among those at risk answer the survey. After analysis of 900 survey results, the epidemiologist concludes that the most suspected foods in the outbreak are pepperoni pizza and meatball spaghetti. What is the overall attack rate for those who ate meatball spaghetti? Use the following table to answer the question. Summary of Survey Responses Number of people who developed the case definition symptoms Number of people who ate the food Pepperoni pizza only 113 275 Meatball spaghetti only 62 375 Both pepperoni pizza and meatball spaghetti 57 150 Neither of pepperoni pizza or meatball spaghetti 10 100 a. 41% b. 38% c. 27% Copyright ยฉ 2020 by Elsevier, Inc. All rights reserved. Test Bank 2-3 d. 40% e. 23% ANS: E To calculate the food-specific attack rate, we need to define how many people are exposed to the specific food and how many people develop the symptoms in the case definition. In this question, we are asking about โ€œoverallโ€ attack rate in those people who ate meatball spaghetti, so we have to add โ€œmeatball spaghetti onlyโ€ and โ€œboth pepperoni pizza and meatball spaghettiโ€ to get the overall rate. Which is 525 (375 plus 150), who are at risk of exposure, and 119 (62 plus 57), who developed the symptoms, corresponding to 23% of attack rate. 5. There was a food poisoning outbreak on April 1, 2018, at the City Z Food Safety Conference. There were 1,000 people registered for the conference with luncheon, 100 volunteers to host attendees, and 50 people who served the luncheon during the conference. Except for 50 people who served the food, all of the participants and volunteers ate the food from the luncheon at the conference on April 1, 2018. After an initial outbreak of food poisoning is reported, an epidemiologist sends surveys to all people at risk to investigate the cause. However, only 900 people among those at risk answer the survey. After analysis of 900 survey results, the epidemiologist concludes that the most suspected foods in the outbreak are pepperoni pizza and meatball spaghetti. What is the most suspected food for food poisoning after cross-tabulation? Use the following table to answer the question. Summary of Survey Responses Number of people who developed the case definition symptoms Number of people who ate the food Pepperoni pizza only 113 275 Meatball spaghetti only 62 375 Both pepperoni pizza and meatball spaghetti 57 150 Neither of pepperoni pizza or meatball spaghetti 10 100 a. Pepperoni pizza only b. Meatball spaghetti only c. Both pepperoni pizza and meatball spaghetti d. Neither pepperoni pizza nor meatball spaghetti e. We cannot determine the cause of food based on this information ANS: A Pepperoni pizza only attack rate is 41.09% (113 divided by 275), and meatball spaghetti only is 16.53% (62 divided by 375). The attack rate of both pepperoni pizza and meatball spaghetti is 38.00% (57 divided by 150). Some may choose both of them which are the most suspected Copyright ยฉ 2020 by Elsevier, Inc. All rights reserved. Test Bank 2-4 food. If both the foods were the most suspected food, we should have a higher attack rate in meatball spaghetti only group as well. 6. What is the name of the occurrence of a clearly higher than expected number of cases of a disease within a limited geographical region? a. Pandemic b. Epidemic c. Endemic d. Zoonosis e. Attack rate ANS: B The definition of epidemic is precisely the occurrence of a clearly higher than habitual number of cases of a disease within a certain geographic region. Pandemic refers to a worldwide epidemic. Endemic refers to the habitual occurrence. Zoonosis describes a disease that is transmitted from animals to humans. 7. Malaria is a parasitic disease transmitted by the Anopheles mosquito bite. This mode of transmission is called a. direct. b. single exposure. c. multiple exposure. d. mosquitosis. e. vector. ANS: E Diseases transmitted by mosquitos are called vector borne. Direct, single exposure, and multiple exposure represent other modes of transmission, and mosquitosis does not exist. 8. An outbreak of measles occurred in City A. There were 1,000 confirmed cases among children younger than 10 years old. Unfortunately, 50 children died of measles. Fifty represent 5% of the total number of cases. What concept is being illustrated in this example? a. Attack rate b. Secondary attack rate c. Case-fatality rate d. Incubation period e. Subclinical disease ANS: C Case-fatality rate is defined as the proportion of people who die of a disease, among the total number of cases of that disease. Attack rate and secondary attack rate refer to the proportion of people (at risk) who develop a disease among the total number of people who were at risk for the disease. Incubation period describes the period between the origin of disease and onset of clinical symptoms. Subclinical disease describes a disease that does not manifest clinically. Copyright ยฉ 2020 by Elsevier, Inc. All rights reserved. Test Bank 2-5 9. During the conquest of Mexico, outbreaks played an important role that favored the Spaniards. There were several outbreaks of smallpox that killed thousands of natives. Smallpox was introduced into America by the Europeans. Why were the natives particularly afflicted by smallpox outbreaks? a. Among natives, the proportion of susceptibles was higher. b. Among Spaniards, the proportion of immunes was extremely low. c. Spaniards had the cure for smallpox. d. Natives had a gene that made them more prone to die from smallpox. e. Spaniards were protected from smallpox because they had armors. ANS: A Because natives were not introduced to the smallpox virus until after the Spaniards arrived, all of them were susceptibles. In a population with a higher proportion of susceptibles, outbreaks can initiate and spread easily. Spaniards had a better balance between susceptibles and immunes; therefore the likelihood of an outbreak happening among them was much lower. 10. The population of Oriol City in June 2018 was 612,437. According to the Oriol Cityโ€™s health department, there were 329 new cases of Ravenโ€™s disease during 2018. Counting those new cases, by December 31 it was estimated that there were 6580 persons with Ravenโ€™s disease in Oriol City. What was the incidence rate of Ravenโ€™s disease in 2018? a. 26 per 100,000 population b. 33 per 100,000 population c. 54 per 100,000 population d. 1074 per 100,000 population e. 5000 per 100,000 population ANS: C The numerator to calculate the incidence rate is the total number of new cases (329), and the denominator is the total number of people who were at risk of developing the condition (in this case we use the population at the middle of that period, 612,437). We express the incidence rate per 100,000 to avoid the decimals: 329/612,437 = 0.000537 ๏‚ด 100,000 = 53.7. 11. The population of Oriol City in June 2018 was 612,437. According to the Oriol Cityโ€™s health department, there were 329 new cases of Ravenโ€™s disease during 2018. Counting those new cases, by December 31 it was estimated that there were 6580 persons with Ravenโ€™s disease in Oriol City. What was the prevalence of Ravenโ€™s disease in 2018? a. 26 per 100,000 population b. 33 per 100,000 population c. 54 per 100,000 population d. 1074 per 100,000 population e. 5000 per 100,000 population ANS: D Copyright ยฉ 2020 by Elsevier, Inc. All rights reserved. Test Bank 2-6 To calculate the prevalence of Ravenโ€™s disease, we use the total number of cases present at the end of the period (6580) divided by the total number of people in that city (612,437), thus: 6580/612,437 = 0.01074 ๏‚ด 100,000 = 1074. Copyright ยฉ 2020 by Elsevier, Inc. All rights reserved.

Document Preview (6 of 82 Pages)

User generated content is uploaded by users for the purposes of learning and should be used following SchloarOn's honor code & terms of service.
You are viewing preview pages of the document. Purchase to get full access instantly.

Shop by Category See All


Shopping Cart (0)

Your bag is empty

Don't miss out on great deals! Start shopping or Sign in to view products added.

Shop What's New Sign in