Chapter 2: Frequency Distributions
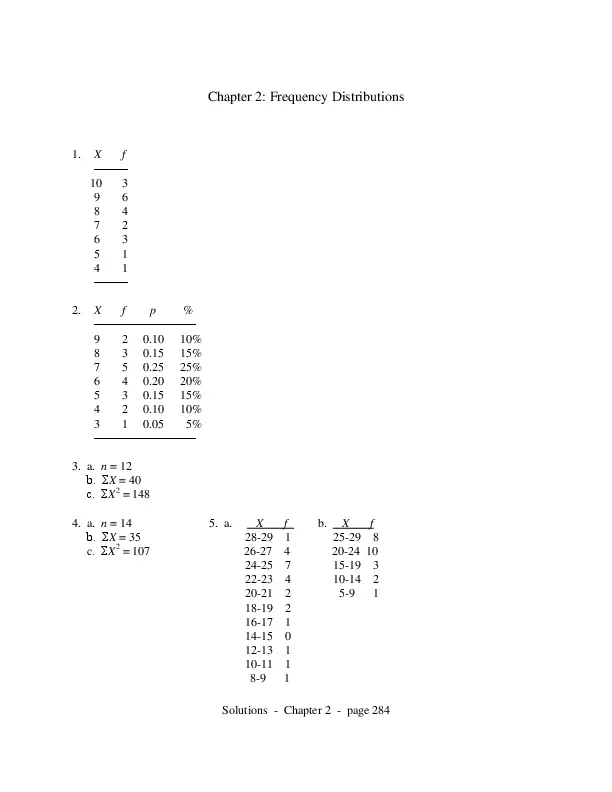
1.
X
f
────
10
3
9
6
8
4
7
2
6
3
5
1
4
1
────
2.
X
f
p
%
────────────
9
2 0.10 10%
8
3 0.15 15%
7
5 0.25 25%
6
4 0.20 20%
5
3 0.15 15%
4
2 0.10 10%
3
1 0.05
5%
────────────
3. a. n = 12
b. ΣX = 40
c. ΣX2 = 148
4. a. n = 14
b. ΣX = 35
c. ΣX2 = 107
5. a.
X
f
28-29 1
26-27 4
24-25 7
22-23 4
20-21 2
18-19 2
16-17 1
14-15 0
12-13 1
10-11 1
8-9
1
b.
X
f
25-29 8
20-24 10
15-19 3
10-14 2
5-9
1
Solutions – Chapter 2 – page 284
6.
X
60-64
55-59
50-54
45-49
40-44
35-39
30-34
25-29
20-24
15-19
f
1
2
2
1
2
3
3
5
8
3
Younger drivers, especially those 20 to 29
years old, tend to get more tickets.
7. a. 2 points wide and around 8 intervals
b. 5 points wide and around 12 intervals or 10 points wide and around 6 intervals
c. 10 points wide and around 9 intervals
8. A regular table reports the exact frequency for each category on the scale of measurement.
After the categories have been grouped into class intervals, the table reports only the overall
frequency for the interval but does not indicate how many scores are in each of the individual
categories.
9. A bar graph leaves a space between adjacent bars and is used with data from nominal or
ordinal scales. In a histogram, adjacent bars touch at the real limits. Histograms are used to
display data from interval or ratio scales.
10. a.
X
10
9
8
7
6
5
4
3
2
1
f
1
0
1
3
1
2
5
4
2
1
Solutions – Chapter 2 – page 285
b.
f
5 │
┌───┐
│
│
│
4 │
┌───┤
│
│
│
│
│
3 │
│
│
│
┌───┐
│
│
│
│
│
│
2 │
┌───┤
│
├───┐
│
│
│
│
│
│
│
│
│
│
1 │ ┌───┤
│
│
│
├───┤
├───┐
┌───┐
│ │
│
│
│
│
│
│
│
│
│
│
└─┴───┴───┴───┴───┴───┴───┴───┴───┴───┴───┴─── X
1
2
3
4
5
6
7
8
9 10 11
11.
7│
6│
┌───┐
5│
│
│
4│
┌───┤
│
f 3│
│
│
├───┐
2│
│
│
│
│
1│┌───┤
│
│
├───┬───┐
└┴───┴───┴───┴───┴───┴───┴──
2
3
4
5
6
7
7│
6│
5│
4│
3│
2│
1│
└
2
3
4
5
6
7
12. a. histogram or polygon (ratio scale)
b. bar graph (ordinal scale)
c. bar graph (nominal scale)
d. histogram or polygon (ratio scale)
e. bar graph (ordinal scale)
Solutions – Chapter 2 – page 286
13. a. A bar graph should be used for measurements from an ordinal scale.
b.
140 │
│
120 │
│
100 │
│
f 80 │
│
60 │
│
40 │
│
20 │
│
───────────────────────────────────
S
M
L
XL
XXL
T-shirt size
14. A bar graph is appropriate for scores measured on an ordinal scale.
160 │
│
140 │
│
120 │
│
f 100 │
│
80 │
│
60 │
│
40 │
│
───────────────────────────────────
A
B
C
D
F
Grade
15. a. ────
X
f
────
9
1
8
1
7
4
6
5
5
7
4
2
Solutions – Chapter 2 – page 287
────
b. positively skewed
────
X f
────
8
2
7
4
6
5
5
3
4
2
3
1
2
2
1
1
────
16.
The distribution in negatively skewed.
17. a. ─────
X
f
─────
10
1
9
2
8
2
7
2
6
4
5
3
4
2
3
2
2
1
─────
b.
4
f
3
2
1
│
│
│
│
│
│
│
│
│
└───────────────────────────────── X
1 2 3 4 5 6 7 8 9 10
c. It is a fairly symmetrical distribution centered at X = 6. The scores are scattered across the
scale.
Solutions – Chapter 2 – page 288
18.
6
5
○
○ – – – ○ Unhappy
f 4
—— Happy
3
○
2
○
○
1
○
○
————————————————————————
1
2
3
4
5
6
7
8
9
10
Number of Friends
Yes, it appears that the happy people tend to have more friends than the unhappy people
do.
19.
20.
──────────────
X
f
cf
c%
──────────────
7
2
25
100
6
3
23
92
5
6
20
80
4
9
14
56
3
4
5
20
2
1
1
4
──────────────
a. The percentile rank for X = 2.5 is 4%
b. The percentile rank for X = 6.5 is 92%
c. The 20th percentile is X = 3.5.
d. The 80th percentile is X = 5.5.
──────────────
X
f
cf
c%
──────────────
50-59 1
20
100
40-49 3
19
95
Solutions – Chapter 2 – page 289
30-39 6
16
80
20-29 5
10
50
10-19 3
5
25
0-9
2
2
10
──────────────
a. The percentile rank for X = 9.5 is 10%
b. The percentile rank for X = 39.5 is 80%
c. The 25th percentile is X = 19.5.
d. The 50th percentile is X = 29.5.
21.
──────────────
X
f
cf
c%
──────────────
10
2
50
100
9
5
48
96
8
8
43
86
7
15
35
70
6
10
20
40
5
6
10
20
4
4
4
8
──────────────
a. The percentile rank for X = 6 is 30%.
b. The percentile rank for X = 9 is 91%
c. The 25th percentile is X = 5.75.
d. The 90th percentile is X = 8.9.
22. a. The percentile rank for X = 15 is 17.5%.
b. The percentile rank for X = 18 is 77.5%.
c. The 15th percentile is X = 14.75.
d. The 90th percentile is X = 19.
23. a. The percentile rank for X = 5 is 8%.
b. The percentile rank for X = 12 is 85%.
c. The 25th percentile is X = 7.
d. The 70th percentile is X = 10.
24. a. The 30th percentile is X = 72.
b. The 88th percentile is X = 93.5.
c. The percentile rank for X = 77 is 40%.
d. The percentile rank for X = 90 is 81%.
Solutions – Chapter 2 – page 290
25.
1│796
2│0841292035826
3│094862
4│543
5│3681
6│4
26. a. 4
b. 72, 71, 78, and 74
c. 2
d. 46 and 40
27.
2 │80472
3 │49069
4 │543976
5 │4319382
6 │5505
7 │24
8 │1
Solutions – Chapter 2 – page 291