Solution Manual for Operations and Supply Chain Management: The Core, 5th Edition

Preview Extract
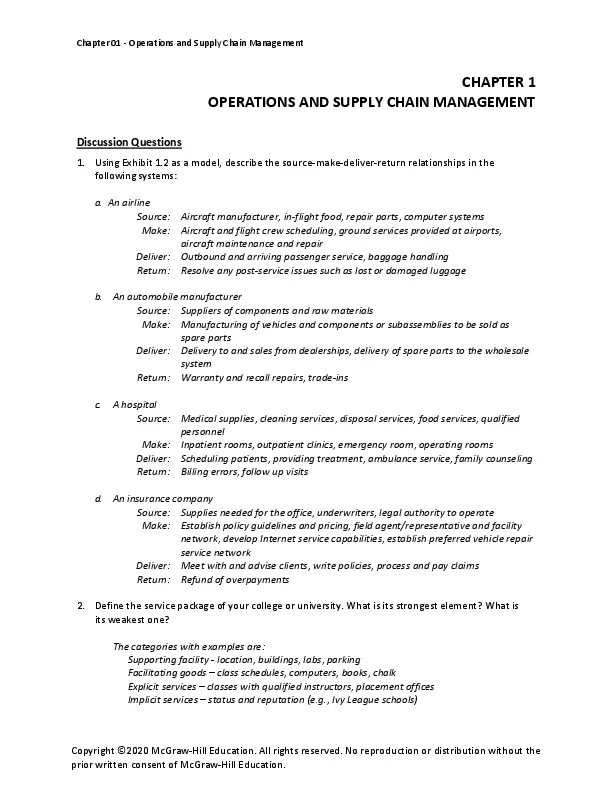
Chapter 01 – Operations and Supply Chain Management CHAPTER 1 OPERATIONS AND SUPPLY CHAIN MANAGEMENT Discussion Questions 1. Using Exhibit 1.2 as a model, describe the source-make-deliver-return relationships in the following systems: a. An airline Source: Aircraft manufacturer, in-flight food, repair parts, computer systems Make: Aircraft and flight crew scheduling, ground services provided at airports, aircraft maintenance and repair Deliver: Outbound and arriving passenger service, baggage handling Return: Resolve any post-service issues such as lost or damaged luggage b. An automobile manufacturer Source: Suppliers of components and raw materials Make: Manufacturing of vehicles and components or subassemblies to be sold as spare parts Deliver: Delivery to and sales from dealerships, delivery of spare parts to the wholesale system Return: Warranty and recall repairs, trade-ins c. A hospital Source: Medical supplies, cleaning services, disposal services, food services, qualified personnel Make: Inpatient rooms, outpatient clinics, emergency room, operating rooms Deliver: Scheduling patients, providing treatment, ambulance service, family counseling Return: Billing errors, follow up visits d. An insurance company Source: Supplies needed for the office, underwriters, legal authority to operate Make: Establish policy guidelines and pricing, field agent/representative and facility network, develop Internet service capabilities, establish preferred vehicle repair service network Deliver: Meet with and advise clients, write policies, process and pay claims Return: Refund of overpayments 2. Define the service package of your college or university. What is its strongest element? What is its weakest one? The categories with examples are: Supporting facility – location, buildings, labs, parking Facilitating goods โ€“ class schedules, computers, books, chalk Explicit services โ€“ classes with qualified instructors, placement offices Implicit services โ€“ status and reputation (e.g., Ivy League schools) Copyright ยฉ2020 McGraw-Hill Education. All rights reserved. No reproduction or distribution without the prior written consent of McGraw-Hill Education. Chapter 01 – Operations and Supply Chain Management At Indiana University and the University of Southern California, among their strongest elements are their business schools and their Operations Management programs (of course). Both also have very dedicated alumni networks. A weak element of Indiana University is its weak football program; for USC, weak elements are on-campus parking and housing. 3. What service industry has impressed you the most with its innovativeness? Our vote goes to cruise lines which have introduced such onboard innovations as wave machines for belly boarding and rock climbing walls, as well as all sorts of other amenities to keep cruisers involved. The industry is doing record business as well. Some of the standout companies in less innovative industries are Bank of America (has a formalized research program to try out new customer services/amenities such as video screens in next to teller lines), Intuit (e.g., putting Quicken money management software online), Ikea, JetBlue Airlines, and Progressive Insurance (discussed later in the book). 4. What is product-service bundling and what are the benefits to customers? Product-service bundling is adding value-added services to a firmโ€™s product offerings to create more value for the customer. This provides benefits in two areas. First, this differentiates the organization from the competition. Secondly, these services tie customers to the organization in a positive way. Alternatively, bundling can also involve adding products to a service, for example, adding the sale of convenience items and snacks at a hotel. 5. What is the difference between a service and a good? A service is an intangible process (you canโ€™t hold it in your hands), while a good is the physical output of a process. Some service businesses also provide a physical good as part of the service, like a restaurant. Also, mots manufacturers of goods provide services for after-sales support, like computer tech support or automobile warranty service. So while a service and a good are definitely distinguishable, customers will often encounter both in their experiences with a company. 6. Some people tend to use the terms effectiveness and efficiency interchangeably, though weโ€™ve seen they are different concepts. But is there any relationship at all between them? Can a firm be effective but inefficient? Very efficient but essentially ineffective? Both? Neither? Firms can be anywhere on these two dimensions. It is possible for a firm to be the best at what they do in serving their market, but be very wasteful in doing so. Alternatively, a firm could squeeze every last dollar out of their processes but fail to deliver what the market expects and desires. Of course, the best firms will provide the goods and services that the market desires, exactly as the market desires, and do so at a minimum cost. Firms that are both inefficient and ineffective do not survive for long in any market. Copyright ยฉ2020 McGraw-Hill Education. All rights reserved. No reproduction or distribution without the prior written consent of McGraw-Hill Education. Chapter 01 – Operations and Supply Chain Management 7. Two of the efficiency ratios mentioned in the chapter are the receivable turnover ratio and the inventory turnover ratio. While they are two completely separate measures, they are very similar in one way. What is the common thread between these two? (There are a number of answers that students may come up with, from simplistic to more thoughtful. Following is one of the latter.) Both are measuring the average amount of a valuable asset that is not generating value for the company. Accounts receivable are an asset, but they do not create value for the firm until the money is received. Reducing the average amount of accounts receivable frees up that money for use by the company on a recurring basis. Inventory is another asset, but while inventory is being held by the company it is not making any money for the firm. Reducing inventory allows the firm to invest the money that would otherwise be spent on the inventory. 8. Look at the job postings at http://jobs.apics.org and evaluate the opportunities for an OSCM major with several years of experience. There are pages and pages of these in the APICS Career Center. Here are some examples: Purchasing and Planning Manager Sennheiser New Mexico Sennheiser is seeking an innovative and enthusiastic individual to manage the purchasing and planning areas at our Albuquerque manufacturing facility. This key role is responsible for leading the Purchasing, Planning and Warehouse departments to achieve outstanding results. You will be charged with ensuring cost effective on-time delivery, as well as building solid relationships with other internal departments and international sister facilities. You will use production planning, procurement, inventory and materials management concepts to solve problems and provide continuous improvement in the supply chain process. Senior Manager Supply Chain Financer Pharmavite This role contributes to Pharmavite’s success by providing decision support to the organization to drive business growth and improve profitability. Responsible for supporting company innovation with respect to total delivered cost. Also supports direct sourcing team on reporting & analyzing purchase price variance and seeking out new cost savings projects. Performs adhoc analysis and/or support cross-functional projects to improve operational efficiencies and optimize profitability. Also manages the control function around headquarters-based operations overhead expenditures as well as capital investments. Medical Device Supply Chain Manager Cadwell The Supply Chain Manager provides overall leadership and mentoring for the purchasing, shipping, and receiving functions for Cadwell Industries, Inc., a leading medical device manufacturer. This position oversees the organization wide management of strategic sourcing, procurement, contract negotiations, and evaluation of services while collaborating closely with staff in Engineering, Marketing, Regulatory, Sales, and Service. Copyright ยฉ2020 McGraw-Hill Education. All rights reserved. No reproduction or distribution without the prior written consent of McGraw-Hill Education. Chapter 01 – Operations and Supply Chain Management Production/Operations Planner CG Industrial Specialties US – Nationwide Reporting to the Operations Manager or Branch Manager; this position is responsible for preparing assembly schedules for shop technicians; coordinate material requirements with purchasing as well as coordinate shipping / receiving activities with warehouse staff. 9. Recent outsourcing of parts and services that had previously been produced internally is addressed by which current issue facing operations and supply management today? The coordination of relationships between mutually supportive but separate organizations. 10. What factors account for the resurgence of interest in OSCM today? With companies facing competition on a global scale, and ever-advancing manufacturing and information technologies, firms realize the competitive advantage their OSCM functions can provide if properly managed. Many have found that the same old way of doing business leaves them unable to compete successfully. The 2011 tsunami in Japan and the 2015 LA ports closure have also brought to the forefront how important supply chains are, as well as the negative economic impact that disruptions in the supply chain can cause. 11. As the field of OSCM has advanced, new concepts have been applied to help companies compete in a number of ways, including the advertisement of the firmโ€™s products or services. One recent concept to gain the attention of companies is promoting sustainability. Discuss how you have seen the idea of sustainability used by companies to advertise their goods or services. There of course will be a number of examples that students will bring up, though they may need some prodding to jog their memories. Some examples to start with might be IBMโ€™s โ€œIโ€™m an IBMerโ€ campaign where they advertise how they are โ€œbuilding a smarter planet.โ€ Bottled water manufacturers have reduced the amount of plastic used in many of their products, thus saving production and distribution costs, but also allowing them to advertise how the new bottles are better for the environment because they result in less waste. Copyright ยฉ2020 McGraw-Hill Education. All rights reserved. No reproduction or distribution without the prior written consent of McGraw-Hill Education. Chapter 01 – Operations and Supply Chain Management Objective Questions 1. What are the three elements that require integration to be successful in operations and supply chain management? Strategy, Processes, and Analytics 2. Operations and supply chain management is concerned with the design and management of the entire system that has what function? Produces a product or delivers a service 3. Consider the following financial data from the past year for Midwest Outdoor Equipment Corporation. Gross Income Total Sales Total Credit Sales Net Income Cost of Goods Sold Total Assets Average Inventory Average Receivables $25,240,000 24,324,000 18,785,000 2,975,000 12,600,000 10,550,000 2,875,000 3,445,000 a. Compute the receivable turnover ratio. $18,785,000 = 5.453 $3,445,000 b. Compute the inventory turnover ratio. $12,600,000 = 4.383 $2,875,000 c. Compute the asset turnover ratio. $24,324,000 = 2.306 $10,550,000 Copyright ยฉ2020 McGraw-Hill Education. All rights reserved. No reproduction or distribution without the prior written consent of McGraw-Hill Education. Chapter 01 – Operations and Supply Chain Management 4. A manufacturing company has entered into a new contract with a major supplier of raw materials used in the manufacturing process. Under the new arrangement, called vendor managed inventory, the supplier manages their raw material inventory inside the manufacturerโ€™s plant, and only bills the manufacturer when the manufacturer consumes the raw material. How is this likely to affect the manufacturerโ€™s inventory turnover ratio? This will reduce the average amount of money the firm has invested in raw material, so the inventory turnover ratio should increase. 5. What is the name of the process in which one company studies the processes of another firm in order to identify best practices? Benchmarking 6. A company has recently implemented an automated online billing and payment processing system for orders it ships to customers. As a result, it has reduced the average number of days between billing a customer and receiving payment by 10 days. How will this affect the receivables turnover ratio? Quicker payments will reduce the average amount of accounts receivables, so the receivables turnover ratio will increase. 7. Match the following OSCM job titles with the appropriate duties and responsibilities. A: Plans and coordinates staff activities such as new product C Plant manager development and new facility location B: Oversees the movement of goods throughout the supply D Supply chain manager chain C: Oversees the workforce and resources required to produce A Project manager the firmโ€™s products Business process D: Negotiates contracts with vendors and coordinates the flow E improvement analyst of material inputs to the production process E: Applies the tools of lean production to reduce cycle time and eliminate waste in a process B Logistics manager 8. What high-level OSCM position manager is responsible for working with the CEO and company president to determine the companyโ€™s competitive strategy? Chief Operating Officer Copyright ยฉ2020 McGraw-Hill Education. All rights reserved. No reproduction or distribution without the prior written consent of McGraw-Hill Education. Chapter 01 – Operations and Supply Chain Management 9. Order the following major concepts that have helped define the OSCM field on a time line. Use 1 for the earliest to be introduced, and 5 for the most recent. 3 Supply chain management 1 Manufacturing strategy 5 Business analytics 2 Total quality management 4 Electronic commerce 10. Which major OSCM concept can be described as an integrated set of activities designed to achieve high-volume production using minimal inventories of parts that arrive at workstations exactly when they are needed? Just-in-time (JIT) production 11. leverage the vast amount of data in enterprise resource planning systems to make decisions related to managing resources. Business analytics 12. Which current issue in OSCM relates to the ability of a firm to maintain balance in a system, considering the ongoing economic, employee, and environmental viability of the firm? Sustainability Copyright ยฉ2020 McGraw-Hill Education. All rights reserved. No reproduction or distribution without the prior written consent of McGraw-Hill Education. Chapter 01 – Operations and Supply Chain Management Analytics Exercise: Comparing Companies Using Wall Street Efficiency Measures Each student is asked to pick an industry and compare three companies within that industry based on income per employee, revenue per employee, receivable turnover, inventory turnover, and asset turnover. The following is typical of what you might obtain: BP Shell ExxonMobil Oil Industry Net Income/Employee 315,300 343,533 414,328 289,320 Revenue/Employee 4.6 Mil 5.2 mil 4.7 mil 3 Mil Receivable Turnover 9.38 6.29 13.17 13.5 Inventory Turnover 11.92 13.59 21.91 15.5 Asset Turnover 1.92 1.36 1.41 1.1 Management Efficiency Students are then asked to identify which company appears to have the most productive employees. With this data we see that ExxonMobil does very well in generating $414,328 net income per employee. Comparing Shell to ExxonMobil we can observe that ExxonMobil appears to be more efficient since it can generate more net income on lower revenue/employee, at least compared to Shell. The inventory turnover is highest for ExxonMobil indicating that the company is the most efficient from an operations and supply chain processes view. ExxonMobil also appears to do a good job in collecting receivables as well, thus supporting the idea that the company is very efficient. BP seems to do a little better in asset turnover, which relates to the use of its facility and equipment assets. But ExxonMobil is very good especially in comparison to the oil industry average. Overall, ExxonMobil appears to be the most efficient, so the other companies might find it valuable to benchmark the companyโ€™s processes. Of course, the data generated by each student will be different and an interesting interchange can be developed with students each presenting what they found from their research. It is very interesting to do comparisons across industries; retailers versus oil companies, and computer makes versus software companies, for example. Copyright ยฉ2020 McGraw-Hill Education. All rights reserved. No reproduction or distribution without the prior written consent of McGraw-Hill Education. Chapter 02 – Strategy and Sustainability CHAPTER 2 STRATEGY AND SUSTAINABILITY Discussion Questions 1. What is meant by a โ€œtriple-bottom-lineโ€ strategy? Give an example of a company that has adopted this type of strategy. A triple-bottom-line strategy places emphasis on a companyโ€™s environmental and social responsibilities as well as the traditional bottom line of economic prosperity. It recognizes that the long-term health of the firm is interdependent with the health of the environment and the betterment of society. There are many examples โ€“ one is Patagonia. For details see their current sustainability page: http://www.patagonia.com/home/ 2. Find examples where companies have used features related to environmental sustainability to โ€œwinโ€ new customers. Car companies use environmental concerns in marketing ads. The development of hybrid and flex-fuel cars is one way they have operationalized those concerns. Consumer goods companies display the โ€œmade with recycled materialโ€ logo on the packaging. Bottled water manufacturers are using and advertising bottles made with less plastic. 3. What are the major priorities associated with operations and supply chain strategy? For each major priority, describe the unique characteristics of the market niche with which it is most compatible. โ€ข Cost: In most every industry, there is a market segment that is very price sensitive. Firms that can supply goods or services at the lowest price will have an advantage there. This requires extremely efficient operations with a continuous focus on cost minimization. As a result, large production volumes are often required to successfully compete here. โ€ข Quality: Similar to the low-cost focused customers, most industries will encounter a market segment willing to pay more for a higher quality product. Typically these goods and services will not be commodity products. Customers may focus on design quality (feature sets, materials, etc.), process quality (fit and finish, reliability, etc.) to differing levels based on the industry. โ€ข Delivery speed and reliability: When a customer has a dire and need for a good or service, companies that can deliver the product the fastest have a distinct advantage. In the businessto-business (B2B) market segment, customers depend on stated delivery windows to achieve reductions in inventory while still meeting strict production windows. โ€ข Changes in volume: Again, this is often important to be a player in many B2B markets. Customers need to know their suppliers can rapidly respond to changes in demand so they can meet the end customer demand swings. 02-1 Chapter 02 – Strategy and Sustainability โ€ข Flexibility and new product introduction speed: The high-tech industry is a good example where this is a key competitive advantage. Being able to rapidly respond to advances in technology and correctly gauge customer expectations is key to competing successfully. 4. Why does the โ€œproperโ€ operations and supply chain strategy keep changing for companies that are world-class competitors? The top three priorities have generally remained the same over time: make it good, make it fast, and deliver it on time. Others have changed. Part of this may be explained by realizing that world class organizations have achieved excellence in these three areas and are, therefore, focusing attention on some of the more minor areas to gain competitive advantage. The changes in the minor priorities may result from recognizing opportunities or from changes in customer desires or expectations. 5. What do the expressions โ€œorder winnerโ€ and โ€œorder qualifierโ€ mean? What was the order winner for your last major purchase of a product or service? Order winners are dimensions that differentiate the product or service or services of one firm from another. Order qualifiers are dimensions that are used to screen a product or service as a candidate for purchase. Order qualifiers get a companyโ€™s โ€œfoot in the door.โ€ Order winners are what make the sale. Obviously, answers will vary for the order winners from your last purchase. 6. Pick a company that you are familiar with and describe its operations strategy and how it relates to winning customers. Describe specific activities used by the company that support the strategy (see Exhibit 2.2 for an example). Student answers will vary widely based on their experiences and views. It might be helpful for a classroom exercise to assign certain companies to a number of students/teams and compare their answers in class. 7. At times in the past, the dollar showed relative weakness with respect to foreign currencies, such as the yen, euro, and pound. This stimulated exports. Why would long-term reliance on a lower valued dollar be at best a short-term solution to the competitiveness problem? This approach is dependent on economic policies of other nations. This is a fragile dependency. A long-term approach is to increase manufacturing and service industry productivity in order to regain competitive advantage. At a national level, solutions appear to lie in reversing attitudes. At a firm level, competitive weapons are consistent quality, high performance, dependable delivery, competitive pricing, and design flexibility. 8. Identify an operations and supply chain – related “disruption” that recently impacted a company. What could the company have done to have minimized the impact of this type of disruption prior to it occurring? The March 2011 tsunami that struck Japan was geographically concentrated but had global impact on multiple firms, many of which had no physical presence at all in the affected area. Examples include firms that had sole source agreements with suppliers in the affected area. The tsunami left these companies scrambling to find new suppliers to feed into their supply chains. These firms could have reduced the impact of the tsunami by having a few high-quality, 02-2 Chapter 02 – Strategy and Sustainability dependable suppliers located in different geographical regions. There are many other examples that could be taken from this one event. A simple Internet search will provide plenty of material for discussion. More recently, the L.A. ports work slowdown in early 2015 was a man-made disruption for many global firms. Both inbound and outbound shipments were affected โ€“ some delayed and others (U.S. produce exports) were ruined. McDonaldโ€™s resorted to flying over 2 million pounds of frozen French fries into Japan at significant extra cost during this period to keep restaurants open. 9. What do we mean when we say productivity is a โ€œrelativeโ€ measure? For productivity to be meaningful, it must be compared with something else. The comparisons can be either intra-company as in the case of year-to-year comparisons of the same measure, or intercompany as in the case of benchmarking. Intercompany comparisons of single factor productivity measures can be somewhat tenuous due to differences in accounting practices (especially when comparing with foreign competitors) and the balance of labor to capital resources. Total factor productivity measures are somewhat more robust for comparison purposes. 02-3 Chapter 02 – Strategy and Sustainability Objective Questions 1. Shell Oil Companyโ€™s motto โ€œPeople, Planet and Profitโ€ is a real-world implementation of what OSCM concept? Triple bottom line 2. A firmโ€™s strategy should describe how it intends to create and sustain value for . Its current shareholders 3. What is the term used to describe individuals or organizations that are influenced by the actions of the firm? Stakeholders 4. How often should a company develop and refine the operations and supply chain strategy. At least yearly 5. What is the term used to describe product attributes that attract certain customers and can be used to form the competitive position of a firm? Competitive dimensions 6. What are the two main competitive dimensions related to product delivery? Delivery speed and delivery reliability 7. What are the two characteristics of a product or service that define quality? Design quality and process quality 8. What is the diagram that shows how a companyโ€™s strategy is delivered by a set of supporting activities called? Activity-system map 02-4 Chapter 02 – Strategy and Sustainability 9. In implementing supply chain strategy, a firm must minimize its total cost without compromising the needs of what group of people? Customers 10. What is defined as the likelihood of disruption that would impact the ability of a company to continuously supply products or services? Supply chain risk 11. What are risks caused by natural or manmade disasters, and therefore impossible to reliably predict called? Disruption risks 12. Match the following common risks with the appropriate mitigation strategy. E D A C B Country risks Regulatory risk Logistics failure Natural disaster Major quality failure A: B: C: D: E: Detailed tracking, alternate suppliers Carefully select and monitor suppliers Contingency planning, insurance Good legal advice, compliance Currency hedging, local sourcing 13. What is the term used to describe the assessment of the probability of a negative event against the aggregate severity of the related loss? Risk mapping 02-5 Chapter 02 – Strategy and Sustainability 14. As Operations Manager, you are concerned about being able to meet sales requirements in the coming months. You have just been given the following production report: JAN FEB MAR APR Units Produced 2300 1800 2800 3000 Hours per Machine 325 200 400 320 Number of Machines 3 5 4 4 Find the average of the monthly productivity figures (units per machine hour). To answer this we need to realize that the measure of hours given is per machine, so we have to multiply that by the number of machines in each period to get the total machine hours in each period. Those figures are used in the calculations below. Average productivity: (2300/975 + 1800/1000 + 2800/1600 + 3000/1280)/4 Average productivity (2.36+1.80+1.75+2.34)/4= 2.06 units per machine hour Note that the average above weights each month the same, although output varies. An alternative answer would be to compute a weighted average productivity figure that is slightly different at 2.04 units per machine hour. 15. Sailmaster makes high-performance sails for competitive windsurfers. Below is information about the inputs and outputs for one model, the Windy 2000. Units sold Sale price each Total labor hours Wage rate Total materials Total energy 1,217 $1,700 46,672 $12/hour $60,000 $4,000 Calculate the productivity in sales revenue/labor expense. We have to do some interim calculations here. Sales revenue is calculated by multiplying units sold by the unit sales price. Labor expense is calculated by multiplying labor hours by the wage rate. (1217*1700) / (46672*12) = 3.69 02-6 Chapter 02 – Strategy and Sustainability 16. Live Trap Corporation received the data below for its rodent cage production unit. Find the total productivity? Output Input 50,000 cages Production time 620 labor hours Sales price: $3.50 per unit Wages $7.50 per hour Raw materials (total cost) $30,000 Component parts (total cost) $15,350 Total productivity could be expressed two ways here based on how you express output: in units sold, or dollars of sales. Units sold: 50,000 / ((620 * $7.50) + 30,000 + 15,350) = 1.00 units sold per dollar input Dollars of sales: (50000*3.5) / ((620 * $7.50) + 30,000 + 15,350) = 3.5 dollars in sales per dollar input 17. Two types of cars (Deluxe and Limited) were produced by a car manufacturer last year. Quantities sold, price per unit, and labor hours are given below. What is the labor productivity for each car? Explain the problem(s) associated with the labor productivity. Deluxe car Limited car Labor, Deluxe Labor, Limited QUANTITY 4,000 units sold 6,000 units sold 20,000 hours 30,000 hours $/UNIT $8,000/car $9,500/car $12/hour $14/hour Labor Productivity โ€“ units/hour Model Deluxe Car Output in Units 4,000 Input in Labor Hours 20,000 Productivity (Output/Input) 0.20 units/hour Limited Car 6,000 30,000 0.20 units/hour Output in Dollars 4,000($8,000)= $32,000,000 Input in Dollars 20,000($12.00)= $240,000 Productivity (Output/Input) 133.33 6,000($9,500)= $57,000,000 30,000($14.00)= $420,000 135.71 Labor Productivity โ€“ dollars Model Deluxe Car Limited Car 02-7 Chapter 02 – Strategy and Sustainability The labor productivity measure is a conventional measure of productivity. However, as a partial measure, it may not provide all of the necessary information that is needed. For example, increases in productivity could result from decreases in quality, and/or increases in material cost. 18. A U.S. manufacturing company operating a subsidiary in an LDC (less-developed country) shows the following results: Sales (units) Labor (hours) Raw materials (currency) Capital equipment (hours) U.S. 100,000 20,000 $20,000 60,000 LDC 20,000 15,000 20,000 (FC) 5,000 a. Calculate partial labor and capital productivity ๏ฌgures for the parent and subsidiary. Do the results seem misleading? Labor Productivity Country U.S. Output in Units 100,000 Input in Hours 20,000 Productivity (Output/Input) 5.00 units/hour LDC 20,000 15,000 1.33 units/hour U.S. Output in Units 100,000 Input in Hours 60,000 Productivity (Output/Input) 1.67 units/hour LDC 20,000 5,000 4.00 units/hour Capital Equipment Productivity Country Yes. You might expect the capital equipment productivity measure to be higher in the U.S. than in a LDC. Also, the measures seem contradictory. Each plant appears to be far more productive than the other on one measure, but much worse on the other. 02-8 Chapter 02 – Strategy and Sustainability b. Compute the multifactor productivity ๏ฌgures for labor and capital together. Do the results make more sense? Multifactor โ€“ Labor and Capital Equipment Country U.S. Output in Units 100,000 Input in Hours 20,000 + 60,000= 80,000 Productivity (Output/Input) 1.25 units/hour LDC 20,000 15,000 + 5,000= 20,000 1.00 units/hour Yes, labor and equipment can be substituted for each other. Therefore, this multifactor measure is a better indicator of productivity in this instance. c. Calculate raw material productivity ๏ฌgures (units/$ where $1 = 10 (FC)). Explain why these ๏ฌgures might be greater in the subsidiary. Raw Material Productivity Country U.S. Output in Units 100,000 Input in Dollars $20,000 Productivity (Output/Input) 5.00 units/$ LDC 20,000 FC 20,000/$10 = $2,000 10.00 units/$ The raw material productivity measures might be greater in the LDC due to a reduced cost paid for raw materials, which is typical of LDCโ€™s, especially if there are local sources for the raw materials. 19. Various ๏ฌnancial data for the past two years follow. Calculate the total productivity measure and the partial measures for labor, capital, and raw materials for this company for both years. What do these measures tell you about this company? Output: Input: Sales Labor Raw materials Energy Capital Other Last Year $200,000 30,000 35,000 5,000 50,000 2,000 This Year $220,000 40,000 45,000 6,000 50,000 3,000 02-9 Chapter 02 – Strategy and Sustainability Total Productivity Year Output in Dollars Input in Dollars Productivity (Output/Input) Last Year $200,000 $30,000 + 35,000 + 5,000 + 50,000 + 2,000 = $122,000 1.64 This Year $220,000 $40,000 + 45,000 + 6,000 + 50,000 +3,000 = $144,000 1.53 Last Year Output in Dollars $200,000 Input in Dollars $30,000 Productivity (Output/Input) 6.67 This Year $220,000 $40,000 5.50 Partial Measure โ€“ Labor Year Partial Measure โ€“ Raw Materials Year Output in Dollars Last Year $200,000 This Year $220,000 Input in Dollars $35,000 Productivity (Output/Input) $45,000 4.89 Input in Dollars $50,000 Productivity (Output/Input) $50,000 4.40 5.71 Partial Measure โ€“ Capital Year Output in Dollars Last Year $200,000 This Year $220,000 4.00 The overall productivity measure is declining, which indicates a possible problem. The partial measures can be used to indicate cause of the declining productivity. In this case, it is a combination of declines in both labor and raw material productivity, which were somewhat offset by an increase in the capital productivity. Further investigation should be undertaken to explain the drops in both labor and raw material productivity. An increase in the cost of both of these measures, without an accompanying increase in the selling price might explain these measures. 02-10 Chapter 02 – Strategy and Sustainability 20. An electronics company makes communications devices for military contracts. The company just completed two contracts. The navy contract was for 2,300 devices and took 25 workers two weeks (40 hours per week) to complete. The army contract was for 5,500 devices that were produced by 35 workers in three weeks. On which contract were the workers more productive? Contract Output in Units Input in Hours Productivity (Output/Input) Navy 2300 25(2)40 = 2000 1.15 Army 5500 35(3)40 = 4200 1.31 The workers were more productive on the Army contract. 21. A retail store had sales of $45,000 in April and $56,000 in May. The store employs eight full-time workers who work a 40-hour week. In April the store also had seven part-time workers at 10 hours per week, and in May the store had nine part-timers at 15 hours per week (assume four weeks in each month). Using sales dollars as the measure of output, what is the percentage change in productivity from April to May? Month Output in Dollars April $45,000 May $56,000 Input in Hours (8(40)+7(10))*4 = 1560 Productivity (Output/Input) 1820 30.77 Percentage Change 28.85 (30.77-28.85)/28.85 = 6.66% increase 22. A parcel delivery company delivered 103,000 packages last year, when its average employment was 84 drivers. This year the ๏ฌrm handled 112,000 deliveries with 96 drivers. What was the percentage change in productivity over the past year? Year Output in Packages Input in Drivers Productivity (Output/Input) Last 103,000 84 1226.2 This 112,000 96 1166.7 02-11 Percentage Change (1166.7 -1226.2)/1226.2 = – 4.85% (decrease) Chapter 02 – Strategy and Sustainability 23. A fast-food restaurant serves hamburgers, cheeseburgers, and chicken sandwiches. The restaurant counts a cheeseburger as equivalent to 1.25 hamburgers and chicken sandwiches as 0.8 hamburger. Current employment is ๏ฌve full-time employees who work a 40-hour week. If the restaurant sold 700 hamburgers, 900 cheeseburgers, and 500 chicken sandwiches in one week, what is its productivity? What would its productivity have been if it had sold the same number of sandwiches (2,100), but the mix was 700 of each type? Part 700 Hamburgers 900 Cheeseburgers (1.25) 500 Chicken Sandwiches (.80) 700 Hamburgers 700 Cheeseburgers (1.25) 700 Chicken Sandwiches (.80) Output in Hamburger Equivalents Input in Hours Productivity (Output/Input) 2225 200 11.125 2135 200 10.675 02-12

Document Preview (20 of 299 Pages)

User generated content is uploaded by users for the purposes of learning and should be used following SchloarOn's honor code & terms of service.
You are viewing preview pages of the document. Purchase to get full access instantly.

Shop by Category See All


Shopping Cart (0)

Your bag is empty

Don't miss out on great deals! Start shopping or Sign in to view products added.

Shop What's New Sign in