Solution Manual for Data Analysis with SPSS: A First Course in Applied Statistics, 4th Edition

Preview Extract
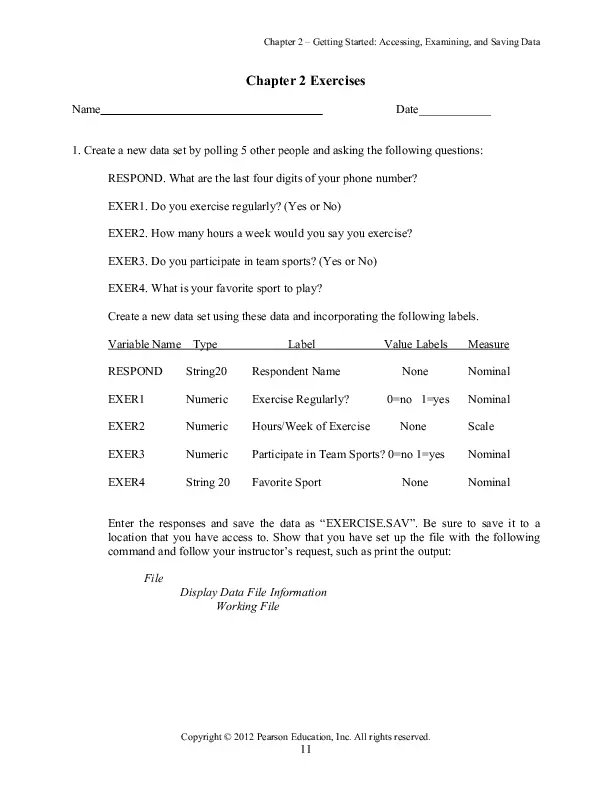
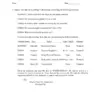
Chapter 2 โ€“ Getting Started: Accessing, Examining, and Saving Data Chapter 2 Exercises Name Date____________ 1. Create a new data set by polling 5 other people and asking the following questions: RESPOND. What are the last four digits of your phone number? EXER1. Do you exercise regularly? (Yes or No) EXER2. How many hours a week would you say you exercise? EXER3. Do you participate in team sports? (Yes or No) EXER4. What is your favorite sport to play? Create a new data set using these data and incorporating the following labels. Variable Name Type Label Value Labels Measure RESPOND String20 Respondent Name None Nominal EXER1 Numeric Exercise Regularly? 0=no 1=yes Nominal EXER2 Numeric Hours/Week of Exercise None Scale EXER3 Numeric Participate in Team Sports? 0=no 1=yes Nominal EXER4 String 20 Favorite Sport Nominal None Enter the responses and save the data as โ€œEXERCISE.SAVโ€. Be sure to save it to a location that you have access to. Show that you have set up the file with the following command and follow your instructorโ€™s request, such as print the output: File Display Data File Information Working File Copyright ยฉ 2012 Pearson Education, Inc. All rights reserved. 11 Instructorโ€™s Manual for Sweet & Grace-Martin, Data Analysis with SPSS, 4/e Copyright ยฉ 2012 Pearson Education, Inc. All rights reserved. 12 Chapter 2 โ€“ Getting Started: Accessing, Examining, and Saving Data 2. Open the data STATES10.SAV. Examine the data set in the Variable View Window and locate some variables that measure the following concepts. Recall that the variable names begin with a 2-letter code for the general topic of the variable. (Double click within the box of variables and scroll up or down to view all of the variables.) A. Economic Prosperity ECS96 Per Capita Gross Domestic Product: 2008 ECS100 Per Capita Personal Income: 2008 ECS103 Median Household Income: 2008 ECS103 Median Household Income: 2008 ECS105 Personal Bankruptcy Rate per 100,000: 2009 ECS445 Homeownership Rate: 2008 B. Substance Abuse HTC254 Percent of High School Students Who Drink Alcohol: 2007 HTC255 Percent of High School Students Who Use Marijuana: 2007 HTH180 Death Rate per 100,000 by Alcohol-Induced Deaths: 2006 HTH503 Adult Per Capita Beer Consumption: 2007 HTH505 Adult Per Capita Wine Consumption: 2007 HTH507 Adult Per Capita Distilled Spirits Consumption: 2007 HTH508 Percent of Adults Who Do Not Drink Alcohol: 2008 HTH510 Percent of Adults Who Smoke: 2008 HTH515 Percent of Population Who are Illicit Drug Users: 2007 HTS420 Adult Per Capita Alcohol Consumption: 2007 C. Educational Attainment EDS127 Percent of Public School 4th Graders Proficient or Better in Reading: 2007 EDS128 Percent of Public School 8th Graders Proficient or Better in Reading: 2007 EDS129 Percent of Public School 4th Graders Proficient or Better in Math: 2009 EDS130 Percent of Public School 8th Graders Proficient or Better in Math: 2009 EDS131 Percent of Population Graduated from High School: 2008 EDS134 Public High School Drop Out Rate: 2007 EDS135 ACT Average Composite Score: 2009 EDS151 Enrollment Rate per 1,000 Aged 18-24 in Institutions of Higher Education: 2006 EDS154 Percent of Population With a Bachelors Degree or More: 2008 Copyright ยฉ 2012 Pearson Education, Inc. All rights reserved. 13 Instructorโ€™s Manual for Sweet & Grace-Martin, Data Analysis with SPSS, 4/e 3. Your stateโ€™s Department of Education hires you as a statistical consultant to help design a data set. They have already sent a survey to school superintendents, and need you to design their data set so they can begin entering information. Below is an example of a survey returned from one school district. Using the survey, answer the questions below, showing how you would design the data set. 1. Number of elementary schools: 8 2. Number of middle schools: 4 3. Number of high schools: 2 4. Average spending per pupil: $7500 5. Student/Teacher ratio: 19/1 6. High School drop-out rate: 10% 7. Does the High School offer AP classes? Yes 8.Type of district: (circle one) Rural Suburban In this data set, what will be a case? Urban School district or Superintendent Design variable names, labels, and measurement types for each of the variables in the study. Variable Name Variable Label Value Labels 1. Answers will vary. All variables should have names 8 digits or fewer. All variables should have variable labels. Variables 7 and 8 should have value labels. Variables 1,2,3,4,5,and 6 are scale variables. Variables 7 and 8 are categorical variables, Copyright ยฉ 2012 Pearson Education, Inc. All rights reserved. 14 Measurement Type Chapter 2 โ€“ Getting Started: Accessing, Examining, and Saving Data 4. Open the GSS08 data and examine the variable SATFIN (Satisfaction with Financial Situation). Can you identify the values and the value labels? Value ____1______ Value ____2______ Value ____3______ Value ____8______ Value ____9______ Value label ___Satisfied ___________________ Value label ___More or Less _______________ Value label ___Not at All Sat________________ Value label ___DK________________________ Value label ___NA________________________ Note, in the GSS08 Data, IAP means โ€œInapplicable,โ€ DK means โ€œDonโ€™t Knowโ€ and NA means โ€œNo Answerโ€. 5. A novice researcher begins an analysis of the GSS08 data and wants to understand the distribution of income in the United States. She looks at the data in the Data View and sees values that range mostly from 1 to 25, but occasionally also sees the number 98 (you can do this by finding the variable INCOME06 in the GSS08 data). She explains to her instructor that the data must be wrong because almost no one has an income of โ€œ10.โ€ Her instructor tells her the data are fine, and asks her to come back when she can tell him how much a family income is for an observation that is listed as โ€œ10โ€. What does โ€œ10โ€ in the INCOME06 variable indicate? __ $12,500-$14,999_____________ What is the reason for the novice researcherโ€™s confusion? The confusion stems from thinking of the data value as being equivalent to the dollar income. In this case, the 10 indicates a value assigned to an income range. In the GSS08 data, โ€œ10โ€ is the value assigned to identify individuals with incomes that range from $12,500-$14,999 in the variable INCOME98. Copyright ยฉ 2012 Pearson Education, Inc. All rights reserved. 15 Instructorโ€™s Manual for Sweet & Grace-Martin, Data Analysis with SPSS, 4/e 6. Open the file FAMILY.SAV that you saved earlier and design 4 new variables to put into the data set and enter in the values. Try to vary the structure of the variables so that you include at least one scale variable, one ordinal variable, and one nominal variable. For example (donโ€™t use this one!), we could add the variable โ€œFISHโ€ with the label โ€œLikes to Fishโ€, the value labels โ€œ0=NO, 1-YESโ€, and the measurement type โ€œNominalโ€. Enter the responses and save the data as โ€œFAMILY2.SAVโ€. Show that you have set up the file with the following command and follow your instructorโ€™s directions, such as print the output: File Display Data File Information Working File Answers will vary. Copyright ยฉ 2012 Pearson Education, Inc. All rights reserved. 16

Document Preview (6 of 82 Pages)

User generated content is uploaded by users for the purposes of learning and should be used following SchloarOn's honor code & terms of service.
You are viewing preview pages of the document. Purchase to get full access instantly.

Shop by Category See All


Shopping Cart (0)

Your bag is empty

Don't miss out on great deals! Start shopping or Sign in to view products added.

Shop What's New Sign in