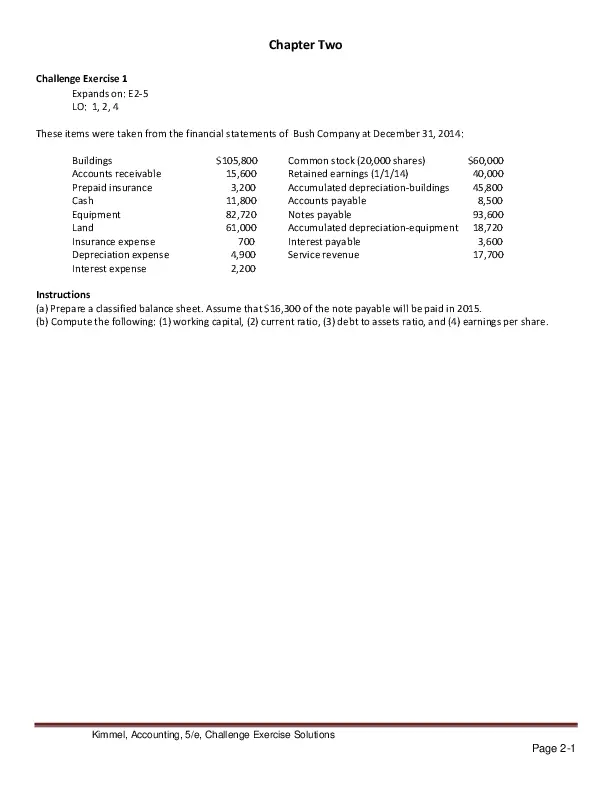
Solution Manual For Accounting: Tools For Business Decision Making, 5th Edition

Preview Extract
Chapter Two Challenge Exercise 1 Expands on: E2-5 LO: 1, 2, 4 These items were taken from the financial statements of Bush Company at December 31, 2014: Buildings Accounts receivable Prepaid insurance Cash Equipment Land Insurance expense Depreciation expense Interest expense $105,800 15,600 3,200 11,800 82,720 61,000 700 4,900 2,200 Common stock (20,000 shares) $60,000 Retained earnings (1/1/14) 40,000 Accumulated depreciation-buildings 45,800 Accounts payable 8,500 Notes payable 93,600 Accumulated depreciation-equipment 18,720 Interest payable 3,600 Service revenue 17,700 Instructions (a) Prepare a classified balance sheet. Assume that $16,300 of the note payable will be paid in 2015. (b) Compute the following: (1) working capital, (2) current ratio, (3) debt to assets ratio, and (4) earnings per share. Kimmel, Accounting, 5/e, Challenge Exercise Solutions Page 2-1 Challenge Exercise 1 โ€“ Solution (a) BUSH COMPANY Balance Sheet December 31, 2014 Assets Current assets Cash . …………………………………………… Accounts receivable ……………………… Prepaid insurance . ………………………… Total current assets . ……………………………. Property, plant, and equipment Land ………………………….. 61,000 Buildings . …………………………………….. $105,800 Less: Accumulated depreciationโ€” buildings . ……….. 45,800 60,000 Equipment . …………………………………… 82,720 Less: Accumulated depreciationโ€” equipment . ………………………… 18,720 Total assets …………………………… Liabilities and Stockholdersโ€™ Equity Current liabilities Accounts payable . ……………………….. Current maturity of note payable …….. Interest payable . …………………………… Total current liabilities ……………. Long-term liabilities Note payable ($93,600 โ€“ $16,300) …… Total liabilities . ………………………. Stockholdersโ€™ equity Common stock . ……………………………. Retained earnings ($40,000 + $9,900*) ………………………. Total stockholdersโ€™ equity ………. Total liabilities and stockholdersโ€™ equity . …………………………………… $11,800 15,600 3,200 $ 30,600 64,000 185,000 $215,600 $ 8,500 16,300 3,600 $ 28,400 77,300 105,700 60,000 49,900 109,900 $215,600 * Net income = $17,700 – $700 – $4,900 – $2,200 = $9,900 Kimmel, Accounting, 5/e, Challenge Exercise Solutions Page 2-2 Challenge Exercise 1 โ€“ Solution (Contโ€™d) (b) (1) Working capital: $30,600 – $28,400 = $2,200 (2) Current ratio: $30,600 รท $28,400 = 1.08 : 1 (3) Debt to assets ratio: $105,700 รท $215,600 = 49% (4) Earnings per share: $9,900 รท 20,000 shares = $0.495 per share Kimmel, Accounting, 5/e, Challenge Exercise Solutions Page 2-3 Challenge Exercise 2 Expands on: E2-13 LO: 7 Mendez Company had three major business transactions during 2014. (a) Security investments with a market value of $10,000 were reported in the financial statements at their original cost $9,300. (b) The death of the companyโ€™s Chief Executive Officer was reported as a $1,000,000 loss in the companyโ€™s income statement. (c) The annual report did not include any notes to the financial statements. Instructions In each situation, identify the assumption or principle that has been violated, if any, and discuss what the company should have done. Challenge Exercise 2 โ€“ Solution (a) This is a violation of the fair value principle. Security investments should be reported at their fair market value in the financial statements. (b) This is a violation of the monetary unit assumption. Only those transactions that can be measured in dollars and cents are recorded and reported in the financial statements. The death of the CEO should be reported in a news release and possibly in the management discussion and analysis section of the annual report. (c) This is a violation of the full disclosure principle. All information capable of making a difference in financial statement usersโ€™ decision-making should be disclosed in the financial statements. The notes to the financial statements are an integral part of the financial statements, and should be included. Kimmel, Accounting, 5/e, Challenge Exercise Solutions Page 2-4 SOLUTIONS TO CASES FOR MANAGEMENT DECISION MAKING CASE 1 1. A predetermined manufacturing overhead rate means that all manufacturing overhead costs, are allocated to each job based on a cost driver. Often this is done based on the expected volume of units produced. That is, products that are produced in higher volume are allocated more overhead. In the case of Wall Dรฉcor, in addition to volume sold, the base used is the cost of each print sold. That is, each print is allocated an amount of manufacturing overhead based on the cost of the print. The management of Wall Dรฉcor felt that this approach was logical because it was expected that more expensive prints would be more likely to be framed, and that the processing of framing requires the incurrence of considerably more overhead costs. 2. The advantages of using the cost of each print as the manufacturing overhead cost driver are that: (1) it is relatively inexpensive to implement in a business, (2) it is easy to explain, and (3) it keeps accounting records in compliance with GAAP. The primary disadvantage of using the cost of each print as the manufacturing overhead cost driver is that it may not result in a reasonable estimate of the cost of a job, batch, or service. That is, the assumed relationshipโ€”that the cost of the print is related to the amount of overhead cost incurredโ€”may be incorrect. Many of the overhead costs incurred are the result of the framing and matting processes. However, the approach used by Wall Dรฉcor will result in a high overhead allocation to expensive prints, even if those prints are not framed. Furthermore, even if overhead costs are related to the cost of prints, and substantially more unframed prints are sold than framed prints, then an inordinate amount of overhead will still be allocated to the unframed prints simply because more of those are sold. By allocating overhead in an inappropriate fashion, product costs are distorted, and, as a consequence, management decision making is affected. Kimmel, Accounting, 5/e, Case Solutions Case 1-1 CASE 1 (Continued) 3. Under a job order costing system, a predetermined overhead rate must be used, since the cost of jobs must be calculated throughout the year (rather than just at year-end). This predetermined overhead rate is based on expected costs and the expected total amount of the cost driver. Therefore, the first thing that must be done is to compute the total expected overhead cost. This step was completed in the information provided by the accounting and production teams. It was determined to be $375,200 (Illustration CA 1-2). The second step is to determine the total expected cost of prints for the period. Unframed: 80,000 X $12 = $ 960,000 Steel-framed: 15,000 X $16 = 240,000 Wood-framed: 7,000 X $20 = 140,000 Total expected cost of prints $1,340,000 Once the total expected overhead cost and total expected print cost are known, the overhead rate can be determined. Predetermined overhead rate = $375,200 รท $1,340,000 = $0.28 This means that for every $1 of print cost, it is assumed that 28ยข of manufacturing overhead costs are consumed. For example, a $12 print will be assigned $3.36 ($12 X $0.28) of overhead. Case 1-2 Kimmel, Accounting, 5/e, Case Solutions CASE 1 (Continued) 4. Lance Armstrong Print John Elway Steel-Framed Print, No Matting Lambeau Field Wood-Framed Print, with Matting $12.00 $16.00 4.00 $20.00 6.00 4.00 2.00 2.00 2.00 Direct material Print Frame and glass Matting Direct labor Picking ([10/60] X $12) Matting and framing ([20/60] X $21) ([30/60] X $21) Manufacturing overhead (0.28 X $12, $16, $20) Total product cost 5. (a) Unframed prints (b) Steel-framed prints (c) Wood-framed prints 7.00 10.50 3.36 $17.36 4.48 $33.48 80,000 X $12 X $0.28 = 15,000 X $16 X $0.28 = 7,000 X $20 X $0.28 = 5.60 $48.10 $268,800 67,200 39,200 $375,200 (d) As a percentage, unframed prints are being allocated 71.6 percent or ($268,800 รท $375,200) of the total overhead cost. 6. No. Unframed prints are being allocated too much manufacturing overhead and framed prints too little manufacturing overhead. In designing the allocation approach, management had assumed that since the average cost of framed prints would exceed the average cost of unframed prints, more of the overhead would be allocated to framed prints. However, the cause of the apparent misallocation is that the volume of unframed prints is much greater than the volume of framed prints. This dramatic difference in volume far outweighs the difference in price. Therefore, unframed prints as a category end up absorbing the bulk of the overhead costs. This does not seem appropriate since a review of the manufacturing overhead costs shows that many of the overhead costs are associated with the framing and matting component of the production area, such as salaries, rent of factory equipment, and information systems. Kimmel, Accounting, 5/e, Case Solutions Case 1-3 CASE 1 (Continued) 7. The high-volume unframed prints will be overcosted and the low-volume framed prints will be undercosted. This will occur because the category of prints that are sold most frequently will generally carry the greatest amount of overhead. For example, in reference to the solution to question 4, the framed and matted print is being allocated only $5.60, but an unframed print is allocated $3.36 of manufacturing overhead. This is not logical because a substantial portion of manufacturing overhead costs is dedicated to framing and matting prints. As a result, Wall Dรฉcor might end up selling framed prints at a price that is too low to cover its cost. Changing the way the overhead is allocated may improve the profit centerโ€™s performance. Case 1-4 Kimmel, Accounting, 5/e, Case Solutions Chapter Two Challenge Exercise 1 Expands on: E2-5 LO: 1, 2, 4 These items were taken from the financial statements of Bush Company at December 31, 2014: Buildings Accounts receivable Prepaid insurance Cash Equipment Land Insurance expense Depreciation expense Interest expense $105,800 15,600 3,200 11,800 82,720 61,000 700 4,900 2,200 Common stock (20,000 shares) $60,000 Retained earnings (1/1/14) 40,000 Accumulated depreciation-buildings 45,800 Accounts payable 8,500 Notes payable 93,600 Accumulated depreciation-equipment 18,720 Interest payable 3,600 Service revenue 17,700 Instructions (a) Prepare a classified balance sheet. Assume that $16,300 of the note payable will be paid in 2015. (b) Compute the following: (1) working capital, (2) current ratio, (3) debt to assets ratio, and (4) earnings per share. Kimmel, Accounting, 5/e, Challenge Exercises Page 2-1 Challenge Exercise 2 Expands on: E2-13 LO: 7 Mendez Company had three major business transactions during 2014. (a) Security investments with a market value of $10,000 were reported in the financial statements at their original cost $9,300. (b) The death of the companyโ€™s Chief Executive Officer was reported as a $1,000,000 loss in the companyโ€™s income statement. (c) The annual report did not include any notes to the financial statements. Instructions In each situation, identify the assumption or principle that has been violated, if any, and discuss what the company should have done. Kimmel, Accounting, 5/e, Challenge Exercises Page 2-2 CCC2 CONTINUING COOKIE CHRONICLE (a) The balance sheet reports the assets, liabilities, and stockholdersโ€™ equity of a company at a specific date. The income statement presents the revenues and expenses and resulting net income or net loss of a company for a specific period of time. The retained earnings statement summarizes the changes in retained earnings for a specific period of time. Finally, the cash flow statement provides information about the cash inflows and cash outflows for a specific period of time. (b) By looking at the balance sheet and the cash flow statement and calculating liquidity ratios we can measure a companyโ€™s short term ability to pay its obligations. Liquidity ratios include the calculation of working capital (current assets minus current liabilities) and current ratio (current assets divided by current liabilities). (c) By looking at the balance sheet and the cash flow statement and calculating solvency ratios we are able to measure a companyโ€™s ability to survive over a long period of time. These solvency ratios include debt to total assets (total liabilities divided by total assets) and free cash flow (cash provided by operations minus dividends and capital expenditures). (d) By looking at the income statement we can determine if Biscuits is profitable. If revenues earned by Biscuits exceed expenses incurred, then Biscuits is profitable. Profitability ratios can measure a companyโ€™s ability to generate earnings over a period of time. One profitability ratio is earnings per share (net income minus preferred dividends divided by average common shares outstanding). (e) By looking at the balance sheet we can determine if Biscuits has any debt. By looking at the balance sheet and cash flow statement and calculating solvency ratios we are able to determine whether a company has the ability to repay its long-term debt. Profitability ratios will help in determining whether a company is able to pay its interest expense. The more profitable the company the better able it is to repay its longterm obligations as well as the amount of interest it is paying on its debt. Kimmel, Accounting, 5/e, Continuing Cookie Chronicle 3 CONTINUING COOKIE CHRONICLE (Continued) (f) By looking at the statement of cash flows we can determine whether Biscuits has paid any dividends to its shareholders. (g) Be aware that financial statements of Biscuits provide a historical perspective of what has already taken place. The financial statements may prove to be a good indicator of what will happen in the future but remember that is not necessarily guaranteed. Consumer tastes change and as a result the demand for Biscuitsโ€™ product may also change. There are other issues that Natalie must consider as well. Does she have the ability to meet the demands of Biscuits? Will she be able to produce 1,500 dozen cookies a week? Does she have enough staff to enable her to do so? Does she have a large enough oven to do so? Does she have enough cash to pay her staff, purchase supplies, and cover operating expenses until she receives payment from Biscuits? 4 Kimmel, Accounting, 5/e, Continuing Cookie Chronicle CHAPTER 2 A Further Look at Financial Statements Learning Objectives 1. 2. 3. Identify the sections of a classified balance sheet. Identify tools for analyzing financial statements and ratios for computing a companyโ€™s profitability. Explain the relationship between a retained earnings statement and a statement of stockholdersโ€™ equity. Identify and compute ratios for analyzing a companyโ€™s liquidity and solvency using a balance sheet. Use the statement of cash flows to evaluate solvency. Explain the meaning of generally accepted accounting principles. Discuss financial reporting concepts. 4. 5. 6. 7. Summary of Questions by Learning Objectives and Bloomโ€™s Taxonomy Item LO BT Item LO BT Item LO BT Item LO BT Item LO BT 14. 15. 16. 17. 7 7 7 6 C C C C 18. 19. 20. 7 7 1 C C C K 7. 6 K 9. AP 8. 7 K 10. AP Do It! Review Exercises AP 3. 4, 5 K 4. 7 7 K K 11. 7 K 7 K 10. 11. 4 4, 5 AP AP 12. 13. 7 7 K C 7. 2, 4, 5 8. 6, 7 E AP 2, 4, 5 8. 6, 7 E AP Questions 1. 2. 3. 4. 5. 1 1 1 1 1 K K C C K 6. 2, 4, 5 7. 2, 4, 5 8. 4 9. 4, 5 C K C C 10. 4, 5 11. 2, 4, 5 12. 6 13. 6, 7 K C K K Brief Exercises 1. 2. 3. 1 1 2 K AP AP 4. 5. 6. 3 4 4, 5 1. 1 AP 2. 1 Exercises 1. 2. 3. 1 1 1 AP AP AP 4. 5. 6. 1 1 1 AP AP AP 7. 2 8. 1, 3, 4 9. 4 AP AP AP Problems: Set A 1. 2. 1. 2. 1 1, 3 1 1, 3 AP AP AP AP 3. 4. 3. 4. 1, 3 2, 4, 5 1, 3 2, 4, 5 Kimmel, Accounting, 5/e, Solutions Manual AP 5. 6. AN AP AN 2, 4, 5 2, 4, 5 AP AP Problems: Set B 5. 2, 4, 5 AP 6. 2, 4, 5 AP 7. 2-1 ASSIGNMENT CHARACTERISTICS TABLE Problem Number 2-2 Description Difficulty Level Time Allotted (min.) 1A Prepare a classified balance sheet. Simple 10โ€“20 2A Prepare financial statements. Moderate 20โ€“30 3A Prepare financial statements. Moderate 20โ€“30 4A Compute ratios; comment on relative profitability, liquidity, and solvency. Moderate 20โ€“30 5A Compute and interpret liquidity, solvency, and profitability ratios. Simple 10โ€“20 6A Compute and interpret liquidity, solvency, and profitability ratios. Moderate 15โ€“25 7A Compute ratios and compare liquidity, solvency, and profitability for two companies. Moderate 15โ€“25 8A Comment on the objectives and qualitative characteristics of financial reporting. Simple 10โ€“20 1B Prepare a classified balance sheet. Simple 10โ€“20 2B Prepare financial statements. Moderate 20โ€“30 3B Prepare financial statements. Moderate 20โ€“30 4B Compute ratios; comment on relative profitability, liquidity, and solvency. Moderate 20โ€“30 5B Compute and interpret liquidity, solvency, and profitability ratios. Simple 10โ€“20 6B Compute and interpret liquidity, solvency, and profitability ratios. Moderate 15โ€“25 7B Compute ratios and compare liquidity, solvency, and profitability for two companies. Moderate 15โ€“25 8B Comment on the objectives and qualitative characteristics of accounting information. Simple 10โ€“20 Kimmel, Accounting, 5/e, Solutions Manual ANSWERS TO QUESTIONS 1. A companyโ€™s operating cycle is the average time that is required to go from cash to cash in producing revenue. 2. Current assets are assets that a company expects to convert to cash or use up within one year of the balance sheet date or the companyโ€™s operating cycle, whichever is longer. Current assets are listed in the order in which they are expected to be converted into cash. 3. Long-term investments are investments in stocks and bonds of other companies where the conversion into cash is not expected within one year or the operating cycle, whichever is longer and plant assets not currently in operational use. Property, plant, and equipment are tangible resources of a relatively permanent nature that are being used in the business and not intended for sale. 4. Current liabilities are obligations that will be paid within the coming year or operating cycle, whichever is longer. Long-term liabilities are obligations that will be paid after one year. 5. The two parts of stockholdersโ€™ equity and the purpose of each are: (1) Common stock is used to record investments of assets in the business by the owners (stockholders). (2) Retained earnings is used to record net income retained in the business. 6. (a) Lorie is not correct. There are three characteristics: liquidity, profitability, and solvency. (b) The three parties are not primarily interested in the same characteristics of a company. Short-term creditors are primarily interested in the liquidity of the company. In contrast, long-term creditors and stockholders are primarily interested in the profitability and solvency of the company. 7. (a) Liquidity ratios: Working capital and current ratio. (b) Solvency ratios: Debt to assets and free cash flow. (c) Profitability ratio: Earnings per share. 8. Debt financing is riskier than equity financing because debt must be repaid at specific points in time, whether the company is performing well or not. Thus, the higher the percentage of assets financed by debt, the riskier the company. 9. (a) Liquidity ratios measure the short-term ability of the company to pay its maturing obligations and to meet unexpected needs for cash. (b) Profitability ratios measure the income or operating success of a company for a given period of time. (c) Solvency ratios measure the companyโ€™s ability to survive over a long period of time. Kimmel, Accounting, 5/e, Solutions Manual 2-3 Questions Chapter 2 (Continued) 10. (a) The increase in earnings per share is good news because it means that profitability has improved. (b) An increase in the current ratio signals good news because the company improved its ability to meet maturing short-term obligations. (c) The increase in the debt to assets ratio is bad news because it means that the company has increased its obligations to creditors and has lowered its equity โ€œbuffer.โ€ (d) A decrease in free cash flow is bad news because it means that the company has become less solvent. The higher the free cash flow, the more solvent the company. 11. (a) The debt to assets ratio and free cash flow indicate the companyโ€™s ability to repay the face value of the debt at maturity and make periodic interest payments. (b) The current ratio and working capital indicate a companyโ€™s liquidity and short-term debtpaying ability. (c) 12. Earnings per share indicates the earning power (profitability) of an investment. (a) Generally accepted accounting principles (GAAP) are a set of rules and practices, having substantial support, that are recognized as a general guide for financial reporting purposes. (b) The body that provides authoritative support for GAAP is the Financial Accounting Standards Board (FASB). 13. (a) The primary objective of financial reporting is to provide information useful for decision making. (b) The fundamental qualitative characteristics are relevance and faithful representation. The enhancing qualities are comparability, consistency, verifiability, timeliness, and understandability. 14. Jantz is correct. Consistency means using the same accounting principles and accounting methods from period to period within a company. Without consistency in the application of accounting principles, it is difficult to determine whether a company is better off, worse off, or the same from period to period. 15. Comparability results when different companies use the same accounting principles. Consistency means using the same accounting principles and methods from year to year within the same company. 16. The cost constraint allows accounting standard-setters to weigh the cost that companies will incur to provide information against the benefit that financial statement users will gain from having the information available. 17. Accounting standards are not uniform because individual countries have separate standardsetting bodies. Currently many non-U.S. countries are choosing to adopt International Financial Reporting Standards (IFRS). It appears that accounting standards in the United States will move toward compliance with IFRS. 2-4 Kimmel, Accounting, 5/e, Solutions Manual Questions Chapter 2 (Continued) 18. Accounting relies primarily on two measurement principles. Fair value is sometimes used when market price information is readily available. However, in many situations reliable market price information is not available. In these instances, accounting relies on historical cost as its basis. 19. The economic entity assumption states that every economic entity can be separately identified and accounted for. This assumption requires that the activities of the entity be kept separate and distinct from (1) the activities of its owners (the shareholders) and (2) all other economic entities. A shareholder of a company charging personal living costs as expenses of the company is an example of a violation of the economic entity assumption. 20. At December 31, 2011 Tootsie Rollโ€™s largest current asset was Cash and Cash Equivalents of $78,612, its largest current liability is accrued liabilities of $43,069 and its largest item under other assets was trademarks of $175,024. (Note: amounts are in thousands) Kimmel, Accounting, 5/e, Solutions Manual 2-5 SOLUTIONS TO BRIEF EXERCISES BRIEF EXERCISE 2-1 CL Accounts payable CA Accounts receivable PPE Accumulated depreciation PPE Buildings CA Cash IA Goodwill CL Income taxes payable LTI Investment in long-term bonds PPE Land CA Inventory IA Patent CA Supplies BRIEF EXERCISE 2-2 MORALES COMPANY Partial Balance Sheet Current assets Cash ………………………………………………………………………………. Debt investments . …………………………………………………………… Accounts receivable . ………………………………………………………. Supplies . ………………………………………………………………………… Prepaid insurance . …………………………………………………………. Total current assets . ………………………………………………… BRIEF EXERCISE 2-3 Net income โ€” Preferred dividends Average common shares outstanding $220 million โ€“ $0 = = $.66 per share 333 million shares Earnings per share = BRIEF EXERCISE 2-4 ICS DRE IRE DRE 2-6 (a) (b) (c) (d) Issued new shares of common stock Paid a cash dividend Reported net income of $75,000 Reported net loss of $20,000 Kimmel, Accounting, 5/e, Solutions Manual $10,400 8,200 14,000 3,800 2,600 $39,000 BRIEF EXERCISE 2-5 Working capital = Current assets โ€“ Current liabilities Current assets Current liabilities Working capital ($102,500,000 201,200,000 ($ 98,700,000) Current ratio: Current assets $102,500,000 = Current liabilities $201,200,000 = .51:1 BRIEF EXERCISE 2-6 Current ratio $262,787 = 0.89:1 $293,625 (b) Debt to assets $376,002 = 85.5% $439,832 (c) Free cash flow $62,300 โ€“ $24,787 โ€“ $12,000 = $25,513 (a) BRIEF EXERCISE 2-7 (a) True. (b) False. BRIEF EXERCISE 2-8 (a) (b) (c) (d) (e) (f) (g) (h) Predictive value. Confirmatory value. Materiality Complete. Free from error. Comparability. Verifiability. Timeliness. Kimmel, Accounting, 5/e, Solutions Manual 2-7 BRIEF EXERCISE 2-9 (a) Relevant. (b) Faithful representation. (c) Consistency. BRIEF EXERCISE 2-10 (a) (b) (c) (d) 1. 2. 3. 4. Predictive value. Neutral. Verifiable. Timely. BRIEF EXERCISE 2-11 (c) SOLUTIONS TO DO IT! REVIEW EXERCISES DO IT! 2-1 LONYEAR CORPORATION Balance Sheet (partial) December 31, 2014 Assets Current assets Cash . …………………………………………………………. 13,000 Accounts receivable . …………………………………. 22,000 Inventory . ………………………………………………….. 58,000 Supplies . …………………………………………………… Total current assets . ………………………… $100,000 Property, plant, and equipment Equipment . ………………………………………………… 180,000 Less: Accumulated depreciationโ€” equipment . ………………………………………. Total assets . ……………………………………………………… 2-8 Kimmel, Accounting, 5/e, Solutions Manual $ 7,000 50,000 130,000 $230,000 DO IT! 2-2 IA CL NA CL LTI CL Trademarks Notes payable (current) Interest revenue Income taxes payable Debt investments (long-term) Unearned sales revenue CA PPE PPE SE NA LTL Inventory Accumulated depreciation Land Common stock Advertising expense Mortgage payable (due in 3 years) DO IT! 2-3 (a) 2014 2013 ($80,000 โ€“ $6,000) = $1.29 (40,000 + 75,000)/2 ($40,000 โ€“ $6,000) = $0.97 (30,000 + 40,000)/2 Benserโ€™s profitability, as measured by the amount of income available for each share of common stock, increased by 33 percent (($1.29 โ€“ $0.97)/$0.97) during 2014. Earnings per share should not be compared across companies because the number of shares issued by companies varies widely. Thus, we cannot conclude that Benser Corporation is more profitable than Matile Corporation based on its higher EPS in 2014. (b) 2014 2013 Current ratio $54,000 = 2.45:1 $22,000 $36,000 = 1.20:1 $30,000 Debt to assets ratio $72,000 = 30% $240,000 $100,000 = 49% $205,000 The companyโ€™s liquidity, as measured by the current ratio improved from 1.20:1 to 2.45:1. Its solvency also improved, because the debt to assets ratio declined from 49% to 30%. (c) Free cash flow 2014: $90,000 โ€“ $6,000 โ€“ $3,000 โ€“ $27,000 = $54,000 2013: $56,000 โ€“ $6,000 โ€“ $1,500 โ€“ $12,000 = $36,500 The amount of cash generated by the company above its needs for dividends and capital expenditures increased from $36,500 to $54,000. Kimmel, Accounting, 5/e, Solutions Manual 2-9 DO IT! 2-4 1. 2. 3. 4. 5. 6. 7. 8. 9. 10. 11. 12. 2-10 Monetary unit assumption Faithful representation Economic entity assumption Cost constraint Consistency Historical cost principle Relevance Periodicity assumption Full disclosure principle Materiality Going concern assumption Comparability Kimmel, Accounting, 5/e, Solutions Manual SOLUTIONS TO EXERCISES EXERCISE 2-1 CL CA PPE PPE CA CL IA CL Accounts payable Accounts receivable Accumulated depreciationโ€”equip. Buildings Cash Interest payable Goodwill Income taxes payable CA CA PPE LTL CA PPE CA Inventory Stock investments Land (in use) Mortgage payable Supplies Equipment Prepaid rent EXERCISE 2-2 CA PPE IA CL CL SE CA LTI Prepaid advertising Equipment Trademarks Salaries and wages payable Income taxes payable Retained earnings Accounts receivable Land (held for future use) Kimmel, Accounting, 5/e, Solutions Manual IA Patents LTL Bonds payable SE Common stock PPE Accumulated depreciationโ€”equipment CL Unearned sales revenue CA Inventory 2-11 EXERCISE 2-3 THE BOEING COMPANY Partial Balance Sheet December 31, 2014 (in millions) Assets Current assets Cash . …………………………………………………………….. 9,215 Debt investments . ………………………………………….. 2,008 Accounts receivable . ……………………………………… 5,785 Notes receivable . …………………………………………… 368 Inventory. ………………………………………………………. Total current assets . ……………………………….. $34,309 Long-term investments Notes receivable . …………………………………………… 5,466 Property, plant, and equipment Buildings . ……………………………………………………… Less: Accumulated depreciationโ€”buildings ….. 8,784 Intangible assets Patents . …………………………………………………………. Total assets . …………………………………………………………. $61,087 2-12 Kimmel, Accounting, 5/e, Solutions Manual $ 16,933 21,579 12,795 12,528 EXERCISE 2-4 H. J. HEINZ COMPANY Partial Balance Sheet April 30, 2014 (in thousands) Assets Current assets Cash. ………………………………………….. Accounts receivable . ………………….. Inventory . …………………………………… Prepaid insurance . ……………………… Total current assets . ……………. 2,908,320 $ 373,145 1,171,797 1,237,613 125,765 $ Property, plant, and equipment Land . ………………………………………….. 76,193 Buildings . …………………………………… $4,033,369 Less: Accumulated depreciationโ€” Buildings . …………………………. 2,131,260 1,902,109 Intangible assets Goodwill . ………………………………………….. Trademarks . …………………………………….. Total assets . …………………………………….. Kimmel, Accounting, 5/e, Solutions Manual 3,982,954 757,907 1,978,302 4,740,861 $ 9,627,483 2-13 EXERCISE 2-5 DONOVAN COMPANY Balance Sheet December 31, 2014 Assets Current assets Cash . ……………………………………………. $11,840 Accounts receivable . …………………….. 12,600 Prepaid insurance . ……………………….. 3,200 Total current assets . ……………………………. 27,640 Property, plant, and equipment Land . ……………………………………………. 61,200 Buildings . …………………………………….. $105,800 Less: Accumulated depreciationโ€” buildings . …………………………… 45,600 60,200 Equipment . …………………………………… 82,400 Less: Accumulated depreciationโ€” Liabilities and Stockholdersโ€™ equipment . …………………………. 18,720 63,680 Equity Current liabilities Total assets Accounts payable. ………………………….. . ………………………… $ 9,500 Current maturity of note payable . …… 13,600 Interest payable . …………………………… 3,600 Total current liabilities . ………….. 26,700 Total liabilities . ………………………. 106,700 Long-term liabilities Stockholdersโ€™ equity Note payable ($93,600 โ€“ $13,600). ….. Common stock . …………………………….. 60,000 Retained earnings ($40,000 + $6,020*) . ……………………… 46,020 Total stockholdersโ€™ equity . …….. Total liabilities and stockholdersโ€™ equity . …………………………………… *Net income = $14,700 โ€“ $780 โ€“ $5,300 โ€“ $2,600 = $6,020 2-14 Kimmel, Accounting, 5/e, Solutions Manual $ 185,080 $212,720 $ 80,000 106,020 $212,720 EXERCISE 2-6 TEXAS INSTRUMENTS, INC. Balance Sheet December 31, 2014 (in millions) Assets Current assets Cash . $ 1,182 Debt investments . 1,743 Accounts receivable . Total current assets . ………………………………….. 1,823 6,114Inventory . 1,202 Long-term investments Prepaid rent . Stock investments . …………………………………………… 164 637 Property, plant, and equipment IntangibleEquipment assets . ……………………………………………………… 6,705 Patents . ……………………………………………………………. depreciationโ€”equipment …… 3,547 TotalLess: assetsAccumulated . ……………………………………………………………. $ 3,158 2,210 $12,119 Liabilities and Stockholdersโ€™ Equity Current liabilities Accounts payable . ……………………………………………. $1,459 Total current ………………………………. Income taxesliabilities payable . ………………………………………. 1,587 128 Long-term liabilities Notes payable . ………………………………………………….. Total liabilities . …………………………………………………. 2,397 Stockholdersโ€™ equity Total stockholdersโ€™ equity . ………………………… Common stock . ………………………………………………… Total liabilities and stockholdersโ€™ equity . …………………. 2,826 Retained earnings . ……………………………………………. 6,896 Kimmel, Accounting, 5/e, Solutions Manual $ 810 9,722 $12,119 2-15 EXERCISE 2-7 (a) Earnings per share = Net income โ€” Preferred dividends Average common shares outstanding 2014 : $66,176,000 โ€“ 0 = $ 1.01 (66,282,000 + 64,507,000) / 2 2013 : $54,587,000 โ€“ 0 = $ .78 (73,139,000+ 66, 282,000) / 2 (b) Using net income (loss) as a basis to evaluate profitability, Callaway Golfโ€™s income improved by 21% [($66,176 โ€“ $54,587) รท 54,587] between 2013 and 2014. Its earnings per share increased by 29% [($1.01 โ€“ $0.78) รท $0.78]. (c) To determine earnings per share, dividends on preferred stock are subtracted from net income, but dividends on common stock are not subtracted. 2-16 Kimmel, Accounting, 5/e, Solutions Manual EXERCISE 2-8 (a) BARFIELD CORPORATION Income Statement For the Year Ended July 31, 2014 Revenues Service revenue. ……………………………………… Rent revenue . …………………………………………. Total revenues . ………………………………… $74,600 Expenses Salaries and wages expense . ………………….. Supplies expense . …………………………………… Depreciation expense . …………………………….. 4,000 Total expenses . ……………………………….. Net loss . ………………………………………………………… (2,500) $66,100 8,500 57,500 15,600 77,100 $ BARFIELD CORPORATION Retained earnings, August 1, 2013 . ………………… Retained Earnings Statement $34,000 For the Year Ended July 31, Less: Net loss . …………………………………………….. $2,500 2014 Dividends . ………………………………………….. 4,000 Retained earnings, July 31, 2014 . …………………… $27,500 (b) 6,500 BARFIELD CORPORATION Balance Sheet July 31, 2014 Assets Current assets Cash. ………………………………………………………. Accounts receivable . ………………………………. Total current assets . ………………………… $38,980) Property, plant, and equipment Equipment . ……………………………………………… 18,500 Less: Accumulated depreciationโ€” equipment . ……………………………….. 12,500) Kimmel, Accounting, 5/e, Solutions Manual Total assets . ………………………………………………….. $51,480) $29,200 9,780 6,000 2-17 EXERCISE 2-8 (Continued) (b) BARFIELD CORPORATION Balance Sheet (Continued) July 31, 2014 Liabilities and Stockholdersโ€™ Equity Current liabilities Accounts payable . ……………………………………. $ 4,100 Salaries and wages payable . …………………….. 2,080 Total current liabilities . ………………………….. 6,180 Total liabilities . ……………………………………… Long-term liabilities 7,980 Notes payable . ………………………………………….. Stockholdersโ€™ equity 1,800 Common stock . ………………………………………… 16,000 Retained earnings . ……………………………………. 27,500 Total stockholdersโ€™ equity. …………………….. $38,980 liabilities equity . ………….. (c) Total Current ratio = and stockholdersโ€™ = 6.3 :1 $51,480 $6,180 $7,980 Debt to assets ratio = = 15.5% $51,480 $ 43,500 (d) The current ratio would not change because equipment is not a current asset and a 5-year note payable is a long-term liability rather than a current liability. The debt to assets ratio would increase from 15.5% to 39.1%*. Looking solely at the debt to assets ratio, I would favor making the sale because Barfieldโ€™s debt to assets ratio of 15.5% is very low. Looking at additional financial data, I would note that Barfield reported a significant loss for the current year which would lead me to question its ability to make interest and loan payments (and even remain in business) in the future. I would not make the proposed sale unless Barfield convinced me that it would be capable of earnings in the future rather than losses. I would also consider making the sale but requiring a substantial downpayment and smaller note. *($7,980 + $20,000) รท ($51,480 + $20,000) 2-18 Kimmel, Accounting, 5/e, Solutions Manual EXERCISE 2-9 (a) Beginning of Year End of Year Working capital $3,361 โ€“ $1,635 = $1,726 $3,217 โ€“ $1,601 = $1,616 Current ratio $3,361 = 2.06:1 $1,635 $3,217 = 2.01:1 $1,601 (b) Nordstromโ€™s liquidity decreased slightly during the year. Its current ratio decreased from 2.06:1 to 2.01:1. Also, Nordstromโ€™s working capital decreased by $110 million. (c) Nordstromโ€™s current ratio at both the beginning and the end of the recent year exceeds Best Buyโ€™s current ratio for 2011 (and 2010). Nordstromโ€™s end-of-year current ratio (2.01) exceeds Best Buyโ€™s 2011 current ratio (1.21*). Nordstrom would be considered much more liquid than Best Buy for the recent year. *(see text, pg. 57) EXERCISE 2-10 $60,000 = 2.0: 1 $30,000 Working capital = $60,000 โ€“ $30,000 = $30,000 (a) Current ratio = $40,000* = 4.0: 1 $10,000** Working capital = $40,000 โ€“ $10,000 = $30,000 (b) Current ratio = *$60,000 โ€“ $20,000 **$30,000 โ€“ $20,000 (c) Liquidity measures indicate a companyโ€™s ability to pay current obligations as they become due. Satisfaction of current obligations usually requires the use of current assets. If a company has more current assets than current liabilities it is more likely that it will meet obligations as they become due. Since working capital and the current ratio compare current assets to current liabilities, both are measures of liquidity. Kimmel, Accounting, 5/e, Solutions Manual 2-19 EXERCISE 2-10 (Continued) Payment of current obligations frequently requires cash. Neither working capital nor the current ratio indicate the composition of current assets. If a companyโ€™s current assets are largely comprised of items such as inventory and prepaid expenses it may have difficulty paying current obligations even though its working capital and current ratio are large enough to indicate favorable liquidity. In Grienkeโ€™s case, payment of $20,000 of accounts payable will leave only $5,000 cash. Since salaries payable will require $10,000, the company may need to borrow in order to make the required payment for salaries. (d) The CFOโ€™s decision to use $20,000 of cash to pay off accounts payable is not in itself unethical. However, doing so just to improve the year-end current ratio could be considered unethical if this action misled creditors. Since the CFO requested preparation of a โ€œpreliminaryโ€ balance sheet before deciding to pay off the liabilities he seems to be โ€œmanagingโ€ the companyโ€™s financial position, which is usually considered unethical. EXERCISE 2-11 2014 (a) Current ratio (b) Earnings per share (c) Debt to assets ratio $925,359 ๏€ฝ 2.30 : 1 $401,763 $179,061 ๏€ฝ $0.87 205,169 $554, 645 $1, 963, 676 (d) Free cash flow = 28.2% 2013 $1,020,834 ๏€ฝ 2.71: 1 $376,178 $400,019 ๏€ฝ $1.85 216,119 $527, 216 $1, 867, 680 = 28.2% $302,193 โ€“ $265,335 โ€“ $82,394 $464,270 โ€“ $250,407 โ€“ $80,796 = ($45,536) = $133,067 (e) Using the debt to assets ratio and free cash flow as measures of solvency produces deteriorating results for American Eagle Outfitters. Its debt to assets ratio remained constant from 2013 to 2014. However, its free cash flow decreased by 134% indicating a significant decline in solvency. (f) In 2013 American Eagle Outfittersโ€™s cash provided by operating activities was greater than the cash used for capital expenditures. It was generating plenty of cash from operations to cover its investing needs. In 2014, American Eagle Outfitters experienced negative free cash flow. This deficiency could have been covered by issuing stock or debt. 2-20 Kimmel, Accounting, 5/e, Solutions Manual EXERCISE 2-12 (a) (b) (c) (d) (e) (f) 2 6 3 4 5 1 Going concern assumption Economic entity assumption Monetary unit assumption Periodicity assumption Historical cost principle Full disclosure principle EXERCISE 2-13 (a) This is a violation of the historical cost principle. The inventory was written up to its fair value when it should have remained at cost. (b) This is a violation of the economic entity assumption. The treatment of the transaction treats Sal Garcia and Garcia Co. as one entity when they are two separate entities. The cash used to purchase the truck should have been treated as part of salaries and wages expense. (c) This is a violation of the periodicity assumption. This assumption states that the economic life of a business can be divided into artificial time periods (months, quarters, or a year). By adding two more weeks to the year, Garcia Co. would be misleading financial statement readers. In addition, 2014 results would not be comparable to previous yearsโ€™ results. The company should use a 52 week year. Kimmel, Accounting, 5/e, Solutions Manual 2-21 SOLUTIONS TO PROBLEMS PROBLEM 2-1A YAHOO! INC. Balance Sheet December 31, 2014 (Amounts are in millions) Assets Current assets Cash . ……………………………………………. $2,292 Debt investments . …………………………. Accounts receivable . …………………….. Total current assets . ………………. Prepaid rent . …………………………………. 4,746233 Long-term investments Stock investments . ……………………….. 3,247 Property, and equipment Less:plant, Accumulated depreciationโ€” Equipment . …………………………………… equipment. ……………………………….. Intangible assets Goodwill . ………………………………………. Patents . ……………………………………….. Total assets . ………………………………………… $13,690 Liabilities and Stockholdersโ€™ Equity Current liabilities Accounts payable . ………………………… Unearned sales revenue . ……………… Total current liabilities . ………….. 565 Long-term liabilities Notes payable . ……………………………… 1,160 1,061 $ $ 1,737 201 1,536 3,927 234 4,161 152 413 $ 734 Total liabilities . …………………… 1,299 Total stockholdersโ€™ equity . ………… Stockholdersโ€™ equity Total liabilitiesCommon and stockholdersโ€™ stock . …………………………….. equity . ………………………………………….. 6,283 Retained earnings . ……………………….. 6,108 2-22 Kimmel, Accounting, 5/e, Solutions Manual 12,391 $13,690 PROBLEM 2-2A TRESH CORPORATION Income Statement For the Year Ended December 31, 2014 Revenues Service revenue . ……………………………………………. $68,000 Expenses Salaries and wages expense . …………………………. Depreciation expense . ……………………………………. 3,600 Insurance expense . ……………………………………….. 2,200 Utilities expense. ……………………………………………. 2,000 Maintenance and repairs expense . …………………. 1,800 Total expenses . ………………………………………. Net income . ………………………………………………………….. $37,000 Retained earnings, January 1, 2014 . ……………………………………… Add: Net income . ………………………………………………………………… TRESH CORPORATION Retained Earnings Statement Less: Dividends . ………………………………………………………………….. For the Year Ended December 31, Retained earnings, December 31, 2014 . …………………………………. 2014 Kimmel, Accounting, 5/e, Solutions Manual 46,600 $21,400 $31,000 21,400 52,400 12,000 $40,400 2-23 PROBLEM 2-2A (Continued) TRESH CORPORATION Balance Sheet December 31, 2014 Assets Current assets Cash . …………………………………………………………….. $10,100 Accounts receivable . ……………………………………… 11,700 Prepaid insurance . ………………………………………… 3,500 Total current assets . ……………………………….. $25,300 Property, plant, and equipment Equipment . ……………………………………………………. 66,000 Less: Accumulated depreciationโ€”equipment … 17,600 Total assets . …………………………………………………………. Liabilities and Stockholdersโ€™ Equity $73,700 Current liabilities Accounts payable . …………………………………………. $18,300 Salaries and wages payable . ………………………….. 3,000 Total current liabilities . …………………………… $21,300 Stockholdersโ€™ equity Common stock . ……………………………………………… 12,000 Retained earnings . ………………………………………… 40,400 Total stockholdersโ€™ equity . ……………………… Total liabilities and stockholdersโ€™ equity. ………………. $73,700 2-24 Kimmel, Accounting, 5/e, Solutions Manual 48,400 52,400 PROBLEM 2-3A (a) RAMIREZ ENTERPRISES Income Statement For the Year Ended April 30, 2014 Sales revenue . ……………………………………………….. $5,100 Expenses Cost of goods sold . ………………………………… $1,060 Salaries and wages expense . …………………. 700 Interest expense . ……………………………………. 400 Total expenses . ………………………………… Net income . …………………………………………………… Depreciation expense . ……………………………. 335 Insurance expense . ………………………………… RAMIREZ ENTERPRISES 210 Retained ……………………………….. Earnings Statement For Income tax expense. the Year Ended April 30, 2014 Retained earnings, May 1, 2013 . ……………………… Add: Net income . …………………………………………. Less: Dividends . …………………………………………… Retained earnings, April 30, 2014 . ………………….. Kimmel, Accounting, 5/e, Solutions Manual 2,870 $2,230 165 $1,600 2,230 3,830 325 $3,505 2-25 PROBLEM 2-3A (Continued) (b) RAMIREZ ENTERPRISES Balance Sheet April 30, 2014 Assets Current assets Cash . …………………………………………….. $1,270 Stock investments . ………………………… Inventory . ………………………………………. 1,200 Prepaid insurance . …………………………. Accounts receivable . ……………………… Total current assets . ……………….. Property, plant, and equipment Land. . …………………………………………….. 3,100 Equipment . …………………………………….. Less: Accumulated depreciationโ€”equipment . ……………. Total assets . …………………………………………. 967 60 810 $4,307 $2,420 670 1,750 4,850 $9,157 Liabilities and Stockholdersโ€™ Equity Current liabilities Notes payable . …………………………………………… $ 61 Accounts payable . ……………………………………… 834 Salaries and wages payable . ………………………. 222 Income taxes payable . ……………………………….. 135 Total liabilities . ……………………………………. Total current liabilities . ……………………….. 4,752 $1,252 Stockholdersโ€™ equity Mortgage payable . ……………………………………… Common stock . ………………………………………….. 900 Retained earnings . …………………………………….. 3,505 Total stockholdersโ€™ equity . ………………….. Total liabilities and stockholdersโ€™ equity . ………….. 2-26 Kimmel, Accounting, 5/e, Solutions Manual 3,500 4,405 $9,157 PROBLEM 2-4A (a) Bosch Companyโ€™s net income for 2014 is $248,000 ($1,800,000 โ€“ $1,175,000 โ€“ $283,000๏€ โ€“ $9,000 โ€“ $85,000). Its earnings per share is $3.10 ($248,000 รท 80,000 shares outstanding). Fielderโ€™s net income for 2014 is $142,200 ($620,000 โ€“ $340,000 โ€“ $98,000 โ€“ $3,800 โ€“ $36,000). Its earnings per share is $2.84 ($142,200 รท 50,000 shares outstanding). (b) Bosch appears to be more liquid. Boschโ€™s 2014 working capital of $340,875 ($407,200 โ€“ $66,325) is more than twice as high as Fielderโ€™s working capital of $156,620 ($190,336 โ€“ $33,716). In addition, Boschโ€™s 2014 current ratio of 6.1:1 ($407,200 รท $66,325) is higher than Fielderโ€™s current ratio of 5.6:1 ($190,336 รท $33,716). (c) Bosch appears to be slightly more solvent. Boschโ€™s 2014 debt to total assets ratio of 18.6% ($174,825 รท $939,200)a is lower than Fielderโ€™s ratio of 22.5% ($74,400 รท $330,064)b. The lower the percentage of debt to assets, the lower the risk is that a company may be unable to pay its debts as they come due. Another measure of solvency, free cash flow, also indicates that Bosch is more solvent. Bosch had $12,000 ($138,000 โ€“ $90,000 โ€“ $36,000) of free cash flow while Fielder had only $1,000 ($36,000 โ€“ $20,000 โ€“ $15,000). a $174,825 ($66,325 + $108,500) is Boschโ€™s 2014 total liabilities. $939,200 ($407,200 + $532,000) is Boschโ€™s 2014 total assets. b $74,400 ($33,716 + $40,684) is Fielderโ€™s 2014 total liabilities. $330,064 ($190,336 + $139,728) is Fielderโ€™s 2014 total assets. Kimmel, Accounting, 5/e, Solutions Manual 2-27 PROBLEM 2-5A (a) (i) Working capital = $458,900 โ€“ $195,500 = $263,400. (ii) Current ratio = $458,900 = 2.35:1. $195,500 (iii) Free cash flow = $190,800 โ€“ $92,000 โ€“ $31,000 = $67,800 (iv) Debt to assets ratio = $395,500 = 38.2%. $1,034,200 (v) Earnings per share = $153,100 = $3.06. 50,000 shares (b) During 2014, the companyโ€™s current ratio increased from 1.65:1 to 2.35:1 and its working capital increased from $160,500 to $263,400. Both measures indicate an improvement in liquidity during 2014. The companyโ€™s debt to assets ratio increased from 31.0% in 2013 to 38.2% in 2014 indicating that the company is less solvent in 2014. Another measure of solvency, free cash flow, increased from $48,700 to $67,800. This suggests an improvement in solvency, thus we have conflicting measures of solvency. Earnings per share decreased from $3.15 in 2013 to $3.06 in 2014. This indicates a decline in profitability during 2014. 2-28 Kimmel, Accounting, 5/e, Solutions Manual PROBLEM 2-6A 2013 (a) Earnings per share. $60,000 = $2.00 30,000 shares 2014 $70,000 = $2.12 33,000 shares (b) Working capital. ($20,000 + $62,000 + $73,000) โ€“ $70,000 = $85,000 ($28,000 + $70,000 + $90,000) โ€“ $75,000 = $113,000 (c) Current ratio. $155,000 = 2.2:1 $70,000 $188,000 = 2.5:1 $75,000 (d) Debt to assets ratio. $160,000 = 23.4% $685,000 (e) Free cash flow. $56,000 โ€“ $38,000 โ€“ $15,000 = $3,000 (f) $155,000 = 20.4% $760,000 $82,000 โ€“ $45,000 โ€“ $20,000 = $17,000 Net income and earnings per share have increased, indicating that the underlying profitability of the corporation has improved. The liquidity of the corporation as shown by the working capital and the current ratio has improved slightly. Also, the corporation improved its solvency by improving its debt to assets ratio as well as free cash flow. Kimmel, Accounting, 5/e, Solutions Manual 2-29 PROBLEM 2-7A Ratio Target Wal-Mart (All Dollars are in Millions) (a) Working capital $17,488 โ€“ $10,512 = $6,976 $48,949 โ€“ $55,390 = ($6,441) (b) Current ratio 1.66:1 ($17,488 รท $10,512) .88:1 ($48,949 รท $55,390) (c) Debt to assets ratio 68.9% ($30,394 รท $44,106) 60.0% ($98,144 รท $163,429) (d) Free cash flow $4,430 โ€“ $3,547 โ€“ $465 = $418 $23,147 โ€“ $11,499 โ€“ $3,746 = $7,902 (e) Earnings per share $2.86 = (f) The comparison of the two companies shows the following: $2,214 774 $3.39 = $13,400 3,951 Liquidityโ€”Targetโ€™s current ratio of 1.66:1 is much better than WalMartโ€™s .88:1 and Target has significantly higher working capital than Wal-Mart. Solvencyโ€”Wal-Martโ€™s debt to assets ratio is about 13% less than Targetโ€™s and its free cash flow is much larger. Profitabilityโ€”Earnings per share should not be used to compare profitability between companies because of the difference in the number of shares outstanding. However, Wal-Martโ€™s profitability as measured by net income is more than 6-times that of Target. 2-30 Kimmel, Accounting, 5/e, Solutions Manual PROBLEM 2-8A (a) Accounting information is the compilation and presentation of financial information for a company. It provides information in the form of financial statements and additional disclosures that is useful for decision making. The accounting rules and practices that have substantial authoritative support and are recognized as a general guide for financial reporting purposes are referred to as generally accepted accounting principles (GAAP). The biotechnology company that employs Sue will follow GAAP to report its assets, liabilities, stockholdersโ€™ equity, revenues, and expenses as it prepares financial statements. (b) Sue is correct in her understanding that the low success rate for new biotech products will be a cause of concern for investors. Her suggestion that detailed scientific findings be reported to prospective investors might offset some of their concerns but it probably wonโ€™t conform to the qualitative characteristics of accounting information. These characteristics consist of relevance, faithful representation, comparability, consistency, verifiability, timeliness, and understandability. They apply to accounting information rather than the scientific findings that Sue wants to include. Kimmel, Accounting, 5/e, Solutions Manual 2-31 PROBLEM 2-1B STARBUCKS CORPORATION Balance Sheet September 30, 2014 (Amounts are in millions) Assets Current assets Cash ………………………………………………………. Debt investments ……………………………………. Accounts receivable ……………………………….. Inventory ………………………………………………… Prepaid rent ……………………………………………. Total current assets…………………………. $1,696 Long-term investments Stock investments ………………………………….. Property, plant and equipment Equipment ……………………………………………… Less: Accumulated depreciationโ€” equipment ………………………………………….. Intangible assets Goodwill …………………………………………………. Total assets ……………………………………………………. Liabilities and Stockholdersโ€™ Equity Current liabilities Notes payable …………………………………………. 1,468 Accounts payable . …………………………………… Unearned sales revenue …………………………. Total current liabilities …………………….. $2,156 Long-term liabilities Notes payable …………………………………………. liabilities ……………………………… Bonds Total payable………………………………………… Totalequity long-term liabilities …………………. Stockholdersโ€™ Common stock ……………………………………….. Retained earnings …………………………………… Total stockholdersโ€™ equity ……………………. Total liabilities and stockholdersโ€™ equity . ……….. 2-32 Kimmel, Accounting, 5/e, Solutions Manual $281 157 288 692 278 280 3,036 145 2,891 477 $5,344 $ 391 297 550 354 3,060 904 40 2,244 2,284 $5,344 PROBLEM 2-2B MUELLER, INC. Income Statement For the Year Ended December 31, 2014 Revenues Service revenue . ……………………………………………. $51,000 Expenses Salaries and wages expense . …………………………. Depreciation expense . ……………………………………. 4,300 Maintenance and repairs expense . …………………. 2,600 Utilities expense. ……………………………………………. 2,100 Insurance expense . ……………………………………….. 1,800 Total expenses . ………………………………………. Net income . ………………………………………………………….. Retained earnings, January 1 . ………………………………. Plus: Net income . ………………………………………………… MUELLER, INC. Retained Earnings Statement Less: Dividends . ………………………………………………….. For the Year Ended December 31, Retained earnings, December 31 . ………………………….. 2014 Kimmel, Accounting, 5/e, Solutions Manual $34,000 44,800 $ 6,200 $14,000 6,200 20,200 2,600 $17,600 2-33 PROBLEM 2-2B (Continued) MUELLER, INC. Balance Sheet December 31, 2014 Assets Current assets Cash . …………………………………………………………… $ 6,100 Accounts receivable . ……………………………………. 2,900 Prepaid insurance . ………………………………………. 2,400 Total current assets . ……………………………… $11,400 Property, plant, and equipment Equipment . ………………………………………………….. 30,000 Less: Accumulated depreciation . ……………….. 7,600 Total assets . ……………………………………………………….. $33,800 Liabilities and Stockholdersโ€™ Equity Current liabilities Accounts payable . ……………………………………….. $ 7,200 Salaries and wages payable . ………………………… 3,000 Total current liabilities . …………………………. $10,200 Stockholdersโ€™ equity Common stock . ……………………………………………. 6,000 Retained earnings . ………………………………………. 17,600 Total stockholdersโ€™ equity . ……………………. Total liabilities and stockholdersโ€™ equity. …………….. $33,800 2-34 Kimmel, Accounting, 5/e, Solutions Manual 22,400 23,600 PROBLEM 2-3B (a) VERN CORPORATION Income Statement For the Year Ended April 30, 2014 Revenues Sales revenue . ……………………………………….. $20,450 Expenses Salaries and wages expense. ………………….. $5,840 Depreciation expense . ……………………………. 3,200 Total expenses Income tax expense…………………………………. ………………………………. Net 700 income . ……………………………………………. Rent expense . ………………………………………… 660 CORPORATION Interest expense .VERN ……………………………………. Retained Earnings Statement For the Year Ended April 30, 2014 Retained earnings, May 1, 2013 . …………………….. Plus: Net income . ………………………………………… Less: Dividends . …………………………………………… Retained earnings, April 30, 2014 . ………………….. Kimmel, Accounting, 5/e, Solutions Manual 10,750 $ 9,700 350 $13,960 9,700 23,660 2,800 $20,860 2-35 PROBLEM 2-3B (Continued) (b) VERN CORPORATION Balance Sheet April 30, 2014 Assets Current assets Cash . ……………………………………………………… $20,955 Accounts receivable . ………………………………. 10,150 Prepaid rent . …………………………………………… 380 Total current assets . ……………………… $31,485 Equipment . ……………………………………………………. 24,250 Less: Accumulated depreciationโ€” Liabilities and Stockholdersโ€™ Equity 6,600 equipment . ………………………………………….. Total assets . ………………………………………………….. Current liabilities $49,135 Accounts payable . ………………………………….. $ 3,100 Income taxes payable. …………………………….. 300 Interest payable . …………………………………….. 175 liabilities . ………………….. Total current liabilities . ………………………………. 8,275 3,575 Stockholdersโ€™ Notes payable equity . ………………………………………………. Common stock . ………………………………………. 4,700 20,000 Retained earnings . ………………………………….. 20,860 Total stockholdersโ€™ equity . …………….. Total liabilities and stockholdersโ€™ equity . ……….. $49,135 2-36 Kimmel, Accounting, 5/e, Solutions Manual 17,650 $ 40,860 PROBLEM 2-4B (a) Wiseโ€™s net income is $215,000 ($900,000๏€ โ€“๏€ $450,000๏€ โ€“๏€ $150,000 โ€“ $10,000 โ€“ $75,000). Its earnings per share is $.43 ($215,000 รท 500,000 shares). Omazโ€™s net income is $74,000 ($450,000 โ€“ $225,000 โ€“ $130,000 โ€“ $6,000 โ€“ $15,000). Its earnings per share is $.37 ($74,000 รท 200,000 shares). (b) Wiseโ€™s 2014 working capital of $470,000 ($700,000 โ€“ $230,000) is over 4 times as high as Omazโ€™s working capital of $105,000 ($180,000 โ€“ $75,000). And Wiseโ€™s 2014 current ratio of 3.0:1 ($700,000 รท $230,000) is higher than Omazโ€™s current ratio of 2.4:1 ($180,000 รท $75,000). (c) Omaz appears to be less solvent. Omazโ€™s 2014 debt to assets ratio of 34% ($265,000 รท $780,000)a is slightly higher than Wiseโ€™s ratio of 29% ($430,000 รท $1,500,000)b. The lower the percentage of debt to assets, the lower the risk that a company may be unable to pay its debts as they come due. Omazโ€™s free cash flow is only $26,000 ($46,000 โ€“ $20,000) compared to $125,000 ($180,000 โ€“ $50,000 โ€“ $5,000) for Wise. More free cash flow indicates that Wise will be better able to finance more capital expenditures without taking on more debt. a $265,000 ($75,000 + $190,000) is Omazโ€™s 2014 total liabilities. $780,000 ($180,000 + $600,000) is Omazโ€™s 2014 total assets. b $430,000 ($230,000 + $200,000) is Wiseโ€™s 2014 total liabilities. $1,500,000 ($700,000 + $800,000) is Wiseโ€™s 2014 total assets. Kimmel, Accounting, 5/e, Solutions Manual 2-37 PROBLEM 2-5B (a) (i) Current ratio = $302,600 = 2.0:1. $148,700 (ii) Working capital = $302,600 โ€“ $148,700 = $153,900. (iii) Debt to assets ratio = $258,700 = 34%. $763,900 (iv) Free cash flow = $61,300 โ€“ $42,000 โ€“ $10,000 = $9,300. (v) Earnings per share = $99,200 = $1.53. 65,000 (b) During 2014, Divineโ€™s current ratio decreased from 2.4:1 to 2.0:1 and its working capital dropped from $178,000 to $153,900. Both measures indicate a slight decline in liquidity during 2014. Divineโ€™s debt to assets ratio increased from 31% in 2013 to 34% in 2014 indicating that the company is less solvent in 2014. Using another measure of solvency, free cash flow, we see that Divineโ€™s solvency has not improved during 2014. Earnings per share increased from $1.35 to $1.53 in 2014. This 13% increase indicates better profitability in 2014. 2-38 Kimmel, Accounting, 5/e, Solutions Manual PROBLEM 2-6B 2013 2014 (a) Earnings per share. $113,000 = $.35 320,000 shares $100,000 = $.27 370,000 shares (b) Working capital. ($30,000 + $55,000 + $73,000) โ€“ $65,000 = $93,000 ($50,000 + $80,000 + $74,000) โ€“ $88,000 = $116,000 (c) Current ratio. $158,000 = 2.43:1 $65,000 $204,000 = 2.32:1 $88,000 (d) Debt to assets ratio. $135,000 = 21.8% $619,000 (e) Free cash flow. $178,000 โ€“ $45,000 โ€“ $13,000 = $120,000 (f) $178,000 = 22.2% $802,000 Free cash flow. $165,000 โ€“ $85,000 โ€“ $20,000 = $60,000 The underlying profitability of the corporation as measured by earnings per share has declined. The overall liquidity of the corporation has dropped as shown by the slight decrease in the current ratio. Also, the corporation appears to be increasing its debt burden as its debt to assets ratio increased slightly indicating a decrease in solvency. Comparing free cash flow, we find a drop in this measure of solvency also. Kimmel, Accounting, 5/e, Solutions Manual 2-39 PROBLEM 2-7B Ratio Home Depot Loweโ€™s (All Dollars are in Millions) (a) Working capital $14,674 โ€“ $12,706 = $1,968 $8,686 โ€“ $7,751 = $935 (b) Current ratio 1.2:1 ($14,674 รท $12,706) 1.1:1 ($8,686 รท $7,751) (c) Debt to assets ratio 60.0% ($26,610 รท $44,324) 47.9% ($14,771 รท $30,869) (d) Free cash flow $5,727 โ€“ $3,558 โ€“ $1,709 = $460 $4,347 โ€“ $4,010 โ€“ $428 = ($91) (e) Earnings per share $2.38 = $4,395 1,849 (f) $1.90 = $2,809 1,481 The comparison of the two companies shows the following: Liquidityโ€”Home Depotโ€™s current ratio of 1.2:1 is slightly better than Lowesโ€™ 1.1:1 and Home Depot has significantly higher working capital than Loweโ€™s. Solvencyโ€”Home Depotโ€™s debt to assets ratio is about 25% more than Loweโ€™s but its free cash flow is much larger. Profitabilityโ€”Home Depotโ€™s earnings per share is about 25% higher than Loweโ€™s. 2-40 Kimmel, Accounting, 5/e, Solutions Manual PROBLEM 2-8B (a) The primary objective of financial reporting is to provide information useful for decision making. Since Yocumโ€™s shares appear to be actively traded, investors must be capable of using the information made available by Yocum to make decisions about the company. (b) The investors must feel as if the company will show earnings in the future. They must recognize that information relevant to their investment choice is indicated by more than Yocumโ€™s net income. (c) The change from Canadian dollars to U.S. dollars for reporting purposes should make Yocumโ€™s more comparable with companies traded on U.S. stock exchanges. Kimmel, Accounting, 5/e, Solutions Manual 2-41 CCC 2-1 CONTINUING COOKIE CHRONICLE (a) The balance sheet reports the assets, liabilities, and stockholdersโ€™ equity of a company at a specific date. The income statement presents the revenues and expenses and resulting net income or net loss of a company for a specific period of time. The retained earnings statement summarizes the changes in retained earnings for a specific period of time. Finally, the cash flow statement provides information about the cash inflows and cash outflows for a specific period of time. (b) By looking at the balance sheet and the cash flow statement and calculating liquidity ratios, we can measure a companyโ€™s short term ability to pay its obligations. Liquidity ratios include the calculation of working capital (current assets minus current liabilities) and current ratio (current assets divided by current liabilities). (c) By looking at the balance sheet and the cash flow statement and calculating solvency ratios we are able to measure a companyโ€™s ability to survive over a long period of time. These solvency ratios include debt to assets (total liabilities divided by total assets) and free cash flow (cash provided by operations minus dividends paid and capital expenditures). (d) By looking at the income statement we can determine if Biscuits is profitable. If revenues earned by Biscuits exceed expenses incurred, then Biscuits is profitable. Profitability ratios can measure a companyโ€™s ability to generate earnings over a period of time. One profitability ratio is earnings per share (net income minus preferred dividends divided by average common shares outstanding). (e) By looking at the balance sheet we can determine if Biscuits has any debt. By looking at the balance sheet and cash flow statement and calculating solvency ratios we are able to determine whether a company has the ability to repay its long-term debt. Profitability ratios will help in determining whether a company is able to pay its interest expense. The more profitable the company the better able it is to repay its longterm obligations as well as the amount of interest it is paying on its debt. 2-42 Kimmel, Accounting, 5/e, Solutions Manual CONTINUING COOKIE CHRONICLE (Continued) (f) By looking at the statement of cash flows we can determine whether Biscuits has paid any dividends to its shareholders. (g) Be aware that financial statements of Biscuits provide a historical perspective of what has already taken place. The financial statements may prove to be a good indicator of what will happen in the future but remember that is not necessarily guaranteed. Consumer tastes change and as a result the demand for Biscuitsโ€™ product may also change. There are other issues that Natalie must consider as well. Does she have the ability to meet the demands of Biscuits? Will she be able to produce 1,500 dozen cookies a week? Does she have enough staff to enable her to do so? Does she have a large enough oven to do so? Does she have enough cash to pay her staff, purchase supplies, and cover operating expenses until she receives payment from Biscuits? Kimmel, Accounting, 5/e, Solutions Manual 2-43 BYP 2-1 FINANCIAL REPORTING PROBLEM (a) Total current assets were $212,201,000 at December 31, 2011, and $235,167,000 at December 31, 2010. (b) Current assets are properly listed in the order of liquidity. As you will learn in a later chapter, inventories are considered to be less liquid than receivables. Thus, they are listed below receivables and before prepaid expenses. (c) The asset classifications are similar to the text: (a) current assets, (b) property, plant, and equipment, and (c) other assets. (d) Total current liabilities were $58,355,000 at December 31, 2011, and $58,505,000 at December 31, 2010. 2-44 Kimmel, Accounting, 5/e, Solutions Manual BYP 2-2 (a) COMPARATIVE ANALYSIS PROBLEM ($ in thousands) Hershey Company Tootsie Roll 1. Working capital $2,046,558 โ€“ $1,173,775 = $872,783 $212,201 โ€“ $58,355 = $153,846 2. Current ratio $2,046,558 รท $1,173,775 = 1.7:1 $212,201 รท $58,355 = 3.6:1 3. Debt to assets ratio $3,539,551 $191,921 * = 80.2% = 22.4% $4,412,199 $857,856 4. Free cash flow $580,867 โ€“ $323,961 โ€“ $304,083 = ($47,177) $50,390 โ€“ $16,351 โ€“ $18,407 = $15,632 5. Earnings per share $628,962 โ€“ 0 $43,938 โ€“ 0 220,688 = $2.85 = $0.76 57,892 *$58,355 + $133,566 (b) Liquidity Hershey Company appears much more liquid since it has about $719 million more working capital than Tootsie Roll. But, looking at the current ratios, we see that Tootsie Rollโ€™s ratio is more than two times as large as Hersheyโ€™s. Solvency Based on the debt to assets ratio, Tootsie Roll is more solvent. Tootsie Rollโ€™s debt to assets ratio is significantly lower than Hersheyโ€™s and, therefore, Tootsie Roll would be considered better able to pay its debts as they come due. Comparing free cash flow, Tootsie Roll generates much more excess cash than Hersheyโ€•$15.6 million versus negative free cash flow of $47 million. Profitability While earnings per share cannot be used to compare profitability between companies, Hersheyโ€™s net income is more than 14-times as great as Tootsie Rollโ€™s. Kimmel, Accounting, 5/e, Solutions Manual 2-45 BYP 2-3 RESEARCH CASE (a) Many large companies, big accounting firms, and accounting standard setters tend to favor a switch to IFRS because they believe that global accounting standards would save companies money by consolidating their bookkeeping. They also believe it would make it easier to raise capital around the world. In addition, investors would have less trouble comparing companies from different countries. They also feel that having international accounting standards would lead to an improvement in the enforcement of securities laws. (b Many small companies are opposed to switching to IFRS because (1) they say that the switch would be very costly, and (2) because they don’t have operations outside of the U.S., so they see any benefit to their company of using international standards. (c) It has been suggested that IFRS lacks standards that are specific to utility companies that U.S. GAAP contains. (d) Condorsement (a word invented by the SEC) represents a combination of convergence and endorsement. Under condorsement, U.S. standard setters would continue to work with international standard setters to try to reduce differences in standards. In addition, as new international standards are issued, U.S. standard setters would review those standards and consider whether to endorse them by absorbing them into U.S. GAAP. 2-46 Kimmel, Accounting, 5/e, Solutions Manual BYP 2-4 INTERPRETING FINANCIAL STATEMENTS (a) The percentage decrease in Gapโ€™s total assets during this period is calculated as: $7,065 โ€“ $8,544 = 17.3% $8,544 The average decrease per year can be approximated as: 17.3% = 4.3% per year 4 years (b) Gapโ€™s working capital and current ratio decreased (2007), increased (2008 and 2009) and then decreased (2010) during this period, indicating a decline, an improvement and then another decline in liquidity. The current ratio is a better measure of liquidity because it provides a relative measure; that is, current assets compared to current liabilities. Working capital only tells us the net amount of current assets less current liabilities. It is hard to say whether a given amount of working capital is adequate or inadequate without knowing the size of the company. (c) The debt to assets ratio suggests that Gapโ€™s solvency didnโ€™t change much during the period. Debt to assets was .39 in 2006, rose to .45 in 2007 and then came back down to .42 in 2010. (d) The earnings per share suggests that Gapโ€™s profitability improved significantly from 2006 to 2010, increasing from $0.94 to $1.89. However, based on the years shown, it appears that earnings varied a great deal during this period. Kimmel, Accounting, 5/e, Solutions Manual 2-47 REAL-WORLD FOCUS BYP 2-5 Answers will vary depending on the company chosen and the date. BYP 2-6 Answers will vary depending on the company chosen and the date. 2-48 Kimmel, Accounting, 5/e, Solutions Manual BYP 2-7 DECISION MAKING ACROSS THE ORGANIZATION The current ratio increase is a favorable indication as to liquidity, but alone tells little about the prospects of the client. From this ratio change alone, it is impossible to know the amount and direction of the changes in individual accounts, total current assets, and total current liabilities. Also unknown are the reasons for the changes. The working capital increase is also a favorable indication as to liquidity, but again the amount and direction of the changes in individual current assets and current liabilities cannot be determined from this measure. The increase in free cash flow is a favorable indicator for solvency. An increase in free cash flow means the company can replace assets, pay dividends, and have โ€œfree cashโ€ available to pay down debt or expand operations. The decrease in the debt to assets ratio is a favorable indicator for solvency and going-concern prospects. The lower the percentage of debt to assets, the lower the risk that a company may be unable to pay its debts as they come due. A decline in the debt to assets ratio is also a positive sign regarding going-concern potential. The increase in net income is a favorable indicator for both solvency and profitability prospects although much depends on the quality of receivables generated from sales and how quickly they can be converted into cash. A significant factor here may be that despite a decline in sales the clientโ€™s management has been able to reduce costs to produce this increase. Indirectly, the improved income picture may have a favorable impact on solvency and going-concern potential by enabling the client to borrow currently to meet cash requirements. The earnings per share increase is a favorable indicator for profitability. A 109% (from $1.15 to $2.40) increase indicates a significant increase in net income and provides a favorable sign regarding going-concern potential. Kimmel, Accounting, 5/e, Solutions Manual 2-49 BYP 2-8 COMMUNICATION ACTIVITY To: F. P. Fernetti From: Accounting Major Subject: Financial Statement Analysis (a) Ratios can be classified into three types, which measure three different aspects of a companyโ€™s financial health: 1. Liquidity ratiosโ€”These measure a companyโ€™s ability to pay its current obligations. 2. Solvency ratiosโ€”These measure a companyโ€™s ability to pay its long-term obligations and survive over the long-term. 3. Profitability ratiosโ€”These measure the ability of the company to generate a profit. (b) 1. Examples of liquidity measures are: Working capital = Current assets โ€“ Current liabilities Current ratio = 2. Current assets Current liabilities Examples of solvency measures are: Debt to assets ratio = Total liabilities Total assets Free cash flow = Cash provided by operating activities โ€“ Capital expenditures โ€“ Cash dividends 2-50 Kimmel, Accounting, 5/e, Solutions Manual BYP 2-8 (Continued) 3. Example of profitability measure: Earnings per share = Net income ๏€ญ Preferred dividends Average common shares outstanding (c) There are three bases for comparing a companyโ€™s results: The bases of comparison are: 1. Intracompanyโ€”This basis compares an item or financial relationship within a company in the current year with the same item or relationship in one or more prior years. 2. Industry averagesโ€”This basis compares an item or financial relationship of a company with industry averages (or norms). 3. Intercompanyโ€”This basis compares an item or financial relationship of one company with the same item or relationship in one or more competing companies. Kimmel, Accounting, 5/e, Solutions Manual 2-51 BYP 2-9 ETHICS CASE (a) The stakeholders in this case are: Boeingโ€™s management; CEO, public relations manager, Boeingโ€™s stockholders, McDonnell Douglas stockholders, other users of the financial statements; especially potential investors of the new combined company. (b) The ethical issues center around full disclosure of financial information. Management attempted to โ€œtimeโ€ the release of bad news in order to complete a merger that would have been revoked if cost overruns had been disclosed as soon as management became aware of them. (c) The periodicity assumption requires that financial results be reported on specific, pre-determined dates. The full disclosure principle requires that all circumstances and events that make a difference to financial statement users must be disclosed. (d) It is not ethical to โ€œtimeโ€ the release of bad news. GAAP requires that all significant financial information be released to allow users to make informed decisions. (e) Answers will vary. One possibility: Release the information regarding cost overruns as it became available. Describe the causes of such overruns and explain how Boeing would address them (probably by improving production methods to eliminate the inefficiencies alluded to in the text). (f) 2-52 Investors and analysts should be aware that Boeingโ€™s management will probably โ€œmanageโ€ information in the future in ways that will interfere with full disclosure. Kimmel, Accounting, 5/e, Solutions Manual BYP 2-10 ALL ABOUT YOU Answers will vary. Kimmel, Accounting, 5/e, Solutions Manual 2-53 BYP 2-11 FASB CODIFICATION ACTIVITY (a) 1. Current assets is used to designate cash and other assets or resources commonly identified as those that are reasonably expected to be realized in cash or sold or consumed during the normal operating cycle of the business. 2. Current liabilities is used principally to designate obligations whose liquidation is reasonably expected to require the use of existing resources properly classifiable as current assets, or the creation of other current liabilities. (b) Access FASB Codification 210-20-45 A right of set off exists when all of the following conditions are met: 2-54 1. Each of two parties owes the other determinable amounts. 2. The reporting party has the right to set off the amount owed with the amount owed by the other party. 3. The reporting party intends to set off. 4. The right of set off is enforceable at law. As a result, a company may not offset accounts payable against cash on its balance sheet. Kimmel, Accounting, 5/e, Solutions Manual BYP 2-12 PEOPLE, PLANET AND PROFIT (a) The existence of three different forms of certification would most likely create confusion for coffee purchasers. It would difficult to know what aspects of the coffee growing process each certification covered. Similarly, if there were multiple groups that certified financial statements, each with different criteria, it would be difficult for financial statement users to know what each certification promised. (b) The Starbucks certification appears to be the most common in that area. It has the advantage of having a direct link to the Starbucks coffee market. Although it does not guarantee that Starbucks will buy its coffee, it is a requirement that must be met before Starbucks will buy somebodyโ€™s coffee. Note that the article states that the Starbucks certification โ€œincorporates elements of social responsibility and environmental leadership, but quality of coffee is the first criteria.โ€ The Smithsonian Bird Friendly is considered to have the strictest requirements and, as a result, appears to be the least common. (c) The certifications have multiple objectives including organic farming as a means to protect bird species, biodiversity and wildlife habitat. Some included requirements are to improve workersโ€™ living conditions, such as providing running water in worker housing, child labor regulations and education requirements. As mentioned above, the Starbucks certification has the potential financial benefit of making Starbucks a potential customer, which can stabilize farmersโ€™ earnings. Certifications can also be financially beneficial because companies can benefit from the positive public relations effects of either producing or buying coffee produced using sustainable practices. Kimmel, Accounting, 5/e, Solutions Manual 2-55 IFRS CONCEPTS AND APPLICATION IFRS 2-1 The statement of financial position required under IFRS and the balance sheet prepared under GAAP usually present the same information regarding a companyโ€™s assets, liabilities, and stockholdersโ€™ equity at a point in time. IFRS does not dictate a specific order but most companies list noncurrent items before current. Differences in ordering are Statement of Financial Position presentation Noncurrent assets Current assets Equity Noncurrent liabilities Current liabilities Balance Sheet presentation Current assets Noncurrent assets Current liabilities Noncurrent liabilities Stockholdersโ€™ equity Under IFRS, current assets are usually listed in the reverse order of liquidity. IFRS 2-2 No, in a recently completed project on the conceptual framework, the two boards agreed on the objective of financial reporting and a common set of desired qualitative characteristics. IFRS 2-3 IFRS uses Share Capitalโ€”Ordinary rather than Common Stock and statement of financial position rather than balance sheet. 2-56 Kimmel, Accounting, 5/e, Solutions Manual IFRS 2-4 RUIZ COMPANY Partial Statement of Financial Position Current assets Prepaid insurance . …………………………………………………………. Supplies . ……………………………………………………………………….. Accounts receivable . ……………………………………………………… Debt investments . ………………………………………………………….. Cash . …………………………………………………………………………….. Total . ………………………………………………………………………. ยฃ 3,600 5,200 12,500 6,700 15,400 ยฃ43,400 IFRS 2-5 WIDMER COMPANY Partial Statement of Financial Position December 31, 2014 Property, plant and equipment Equipment . ………………………………………….. Less: Accumulated depreciation . ………… Long-term investments Share investments . ………………………………. 6,500 Current assets Inventories . ………………………………………….. Accounts receivable . ……………………………. Debt investments . ………………………………… Cash . …………………………………………………… Total assets . ……………………………………………….. CHF43,220 Kimmel, Accounting, 5/e, Solutions Manual CHF21,700 5,700 CHF16,000 2,900 4,300 120 13,400 20,720 2-57 IFRS 2-6 COLE BOWLING ALLEY Statement of Financial Position December 31, 2014 Assets Property, plant, and equipment Land . ………………………………………. $64,000 Buildings . ……………………………….. $128,800 Less: Acc. depr.โ€”buildings . ……. 42,600 86,200 Equipment . ……………………………… 62,400 Less: Acc. depr.โ€”equipment . ….. 18,720 43,680 $193,880 Current assets Prepaid insurance . ………………….. 4,680 Accounts receivable. ……………….. 14,520 Cash . ………………………………………. 18,040 Total assets. …………………………………… Equity and Liabilities Equity Share capitalโ€”ordinary . ………………………. $100,000 Retained earnings ($15,000 + $3,440*) . …. 18,440 Non-current liabilities Notes payable . …………………………………….. 83,880 Current liabilities Current portion of notes payable . ………… 13,900 Accounts payable . ……………………………….. 12,300 Interest payable . ………………………………….. 2,600 Total equity and liabilities . ………………………….. *Net income = $14,180 โ€“ $780 โ€“ $7,360 โ€“ $2,600 = $3,440 37,240 $231,120 $118,440 28,800 $231,120 IFRS 2-7 It is possible to compare liquidity and solvency for companies using different currencies. The ratios that are used to do so, such as the current ratio and debt to total assets, indicate relative amounts of assets and liabilities rather than absolute monetary values. 2-58 Kimmel, Accounting, 5/e, Solutions Manual IFRS 2-8 INTERNATIONAL COMPARATIVE ANALYSIS PROBLEM Differences in the format of the statement of financial position (balance sheet) used by Zetar and Tootsie Roll include the following: 1. 2. 3. 4. 5. 6. 7. Zetar Tootsie Roll Non-current assets listed first Goodwill listed before property, plant and equipment Current assets are shown in reverse order of liquidity with cash being last Current liabilities are subtracted from current assets to show net current liabilities/assets Total liabilities are subtracted from total assets to show net assets The equity section uses Share capital and Share premium Current assets listed first Property, plant, and equipment listed before goodwill Current assets are shown in order of liquidity with cash being first No similar amount appears Reporting currency is ยฃ (pounds) Kimmel, Accounting, 5/e, Solutions Manual No similar amount appears The equity section uses Common stock and Capital in excess of par value Reporting currency is $ (dollars) 2-59 CHAPTER 2 SOLUTIONS TO EXERCISESโ€”SET B EXERCISE 2-1B CL CA PPE PPE CA CA IA CL Accounts payable Accounts receivable Accumulated depreciationโ€”buildings Buildings Cash Interest receivable Goodwill Notes payable CA LTI PPE LTL CA PPE CA Inventory Investments Land Mortgage payable Supplies Equipment Prepaid rent EXERCISE 2-2B CA PPE IA CL CL SE CA PPE Prepaid rent Equipment Copyrights Salaries and wages payable Income taxes payable Retained earnings Accounts receivable Land Kimmel, Accounting, 5/e, Exercise B/Problem Set C IA LTL SE PPE Patents Bonds payable Common stock Accumulated depreciationโ€”equipment CL Unearned sales revenue CA Inventory 2-1 EXERCISE 2-3B BOEING COMPANY Partial Balance Sheet December 31, 2014 (in millions) Assets Current assets Cash . …………………………………………………………….. 7,042 Debt investments . ………………………………………….. 2,266 Accounts receivable . ……………………………………… 5,740 Notes receivable . ………………………………………….. 328 Inventory. ………………………………………………………. Total current assets . ……………………………….. $24,939 Long term investments Notes receivable . …………………………………………… 6,777 Property, plant, and equipment Buildings . ……………………………………………………… Less: Accumulated depreciationโ€”buildings ….. 8,265 Intangible assets Patents . ………………………………………………………… Total assets . …………………………………………………………. $56,645 2-2 Kimmel, Accounting, 5/e, Exercise B/Problem Set C $ 9,563 20,180 11,915 16,664 EXERCISE 2-4B H. J. HEINZ COMPANY Partial Balance Sheet April 30, 2014 (in thousands) Assets Current assets Cash . ………………………………………… Accounts receivable . …………………. Inventory . ………………………………….. 1,378,216 Prepaid insurance . ……… Total current assets . …………… Property, plant, and equipment Land . …………………………………………. 56,007 Buildings . ………………………………….. $4,344,269 Less: Accumulated depr-buildings 2,295,563 2,104,713 Intangible assets . ………………. Goodwill . …………………………………… TotalTrademarks assets . …………………………………….. . ………………………………. 723,243 Kimmel, Financial Accounting, 7/e Exercise B $ 617,687 1,161,481 168,182 $ 3,325,566 2,048,706 4,411,521 5,134,764 $10,565,043 2-3 EXERCISE 2-5B TROTTER COMPANY Balance Sheet December 31, 2014 Assets Current assets Cash . ………………………………………………….. $18,840 Accounts receivable . …………………………… 10,600 Prepaid insurance . ……………………………… 3,200 Total current assets . …………………….. $ 32,640 Property, plant, and equipment Land . ………………………………………………….. 61,200 Buildings . …………………………………………… $115,800 Less: Accumulated depreciationโ€” buildings . ………………………………… 45,600 70,200 Equipment . …………………………………………. 82,400 Less: Accumulated depreciationโ€” Liabilities and Stockholdersโ€™ Equity equipment . ………………………………. 18,720 63,680 195,080 Current liabilities Total assets $227,720 Accounts payable. ………………………………… . ………………………………. $ 9,500 Current maturity of note payable . …………. 13,600 Interest payable . …………………………………. 3,600 Total current liabilities . …………………………….. liabilities . ………………… $106,700 Stockholdersโ€™ equity 26,700 Common stock . …………………………………… 75,000 Long-term liabilities Retained earnings Note payable ($93,600 โ€“ $13,600). ………… 80,000 ($40,000 + $6,020*) . ………………………….. 46,020 Total stockholdersโ€™ equity . …………… 121,020 Total liabilities and stockholdersโ€™ equity . ………….. …… $227,720 *$14,700 โ€“ $780 โ€“ $5,300 โ€“ $2,600 = $6,020 2-4 Kimmel, Accounting, 5/e, Exercise B/Problem Set C EXERCISE 2-6B TEXAS INSTRUMENTS, INC. Balance Sheet December 31, 2014 (in millions) Assets Current assets Cash . $ 1,328 Debt investments . 1,596 Accounts receivable . 1,742 Inventory Total .current assets . ………………………………….. 6,918 Prepaid rent . Long-term investments Stock investments . …………………………………………… 267 Property, plant, and equipment Equipment . ……………………………………………………….. Less: Accumulated depreciationโ€”equipment …… Intangible assets Patents . ……………………………………………………………. Total assets . ……………………………………………………………. $ 1,418 834 7,568 3,959 3,609 1,873 $12,667 Liabilities and Stockholdersโ€™ Equity Current liabilities Total current liabilities . ………………………………. Accounts payable . ……………………………………………. $1,368 2,025 Income liabilities taxes payable . ………………………………………. 657 Noncurrent Notes payable . ………………………………………………….. Total liabilities . ………………………………………………………… 2,692 Stockholdersโ€™ equity Common stock . ………………………………………………… Total stockholdersโ€™ equity . ………………………… Total liabilities and stockholdersโ€™ equity . …………………. 2,671 Retained earnings . ……………………………………………. 7,304 Kimmel, Financial Accounting, 7/e Exercise B $ 667 9,975 $12,667 2-5 EXERCISE 2-7B (a) Earnings (loss) per share = Net income โ€” Preferred dividends Average common shares outstanding 2014 : $(18,804) โ€“ 0 = $(0.29) (64,473,000+ 64,406,000) / 2 2013 : $(15,260) โ€“ 0 = $(0.24) (64,507,000 + 64,473,000) / 2 (b) Using net loss as a basis to evaluate profitability, Callaway Companyโ€™s net loss increased by 23% [($18,804 โ€“ $15,260) รท $15,260]. Its loss per share increased by 21% [($0.29 โ€“ $0.24) รท $0.24]. (c) To determine earnings (loss) per share, dividends on preferred stock are subtracted from net income (added to net loss), but dividends on common stock are not subtracted. 2-6 Kimmel, Accounting, 5/e, Exercise B/Problem Set C EXERCISE 2-8B (a) WI-HAUL CORPORATION Income Statement For the Year Ended July 31, 2014 Revenues Service revenue . …………………………………….. Rent revenue. …………………………………………. Total revenues . ……………………………….. $74,600 Expenses Salaries and wages expense . …………………. Supplies expense . ………………………………….. Depreciation expense . ……………………………. 4,000 Total expenses . ………………………………. Net loss . ……………………………………………………….. (4,500) $66,100 8,500 57,500 17,600 79,100 $ WI-HAUL CORPORATION Retained earnings, August 1, 2013 . ……………….. Retained Earnings Statement $34,000 For the Year Ended July 31, Less: Net loss . ……………………………………………. $4,500 2014 Dividends . …………………………………………. 4,000 Retained earnings, July 31, 2014 . ………………….. $25,500 (b) 8,500 WI-HAUL CORPORATION Balance Sheet July 31, 2014 Assets Current assets Cash . ……………………………………………………… Accounts receivable . ……………………………… Total current assets . ……………………….. $37,980 Property, plant, and equipment Equipment . …………………………………………….. 17,500 Less: Accumulated depreciationโ€” equipment . ………………………………. Total assets Kimmel, Financial Accounting, 7/e Exercise B . ……………………………………. $26,200 11,780 6,000 11,500 $49,480 2-7 EXERCISE 2-8B (Continued) (b) WI-HAUL CORPORATION Balance Sheet (Continued) July 31, 2014 Liabilities and Stockholdersโ€™ Equity Current liabilities Accounts payable . ……………………………………….. $ 4,100 Salaries and wages payable . ………………………… 2,080 Total current liabilities . ……………………………. 6,180 Total liabilities . ……………………………………….. 7,980 liabilities Long-term Stockholdersโ€™ Notes payable equity . …………………………………………….. 1,800Common stock . ……………………………………………. 16,000 Retained earnings . ………………………………………. 25,500 Total stockholdersโ€™ equity. ………………………. $37,980 (c) Current ratio = Total liabilities = 6.1: 1 and stockholdersโ€™ equity . $49,480 $6,180 $7,980 Debt to assets ratio = = 16.1% $49,480 $ 41,500 (d) The current ratio would not change because equipment is not a current asset and a 5-year note payable is a long-term liability rather than a current liability. The debt to assets ratio would increase from 16.1% to 40.3%*. Looking solely at the debt to assets ratio, I would favor making the sale because Wi-Haulโ€™s debt to assets ratio of 16.1% is very low. Looking at additional financial data, I would note that Wi-Haul reported a significant loss for the current year which would lead me to question its ability to make interest and loan payments (and even remain in business) in the future. I would not make the proposed sale unless Wi-Haul convinced me that it would be capable of earnings in the future rather than losses. I would also consider making the sale but requiring a substantial down-payment and smaller note. *($7,980 + $20,000) รท ($49,480 + $20,000) 2-8 Kimmel, Accounting, 5/e, Exercise B/Problem Set C EXERCISE 2-9B (a) Beginning of Year End of Year Working capital $2,742 โ€“ $1,433 = $1,309 $3,361 โ€“ $1,635 = $1,726 Current ratio $2,742 = 1.91:1 $1,433 $3,361 = 2.06:1 $1,635 (b) Nordstromโ€™s liquidity increased during the year. Its current ratio increased from 1.91:1 to 2.06:1. Also, Nordstromโ€™s working capital increased by $417,000,000. (c) Nordstromโ€™s current ratio at both the beginning and the end of the recent year exceeds Best Buyโ€™s current ratio for 2011 and 2010. Nordstromโ€™s end-of-year current ratio (2.06) exceeds Best Buyโ€™s 2011 current ratio of 1.21 (see page 59 of text). Nordstrom would be considered much more liquid than Best Buy for the recent year. EXERCISE 2-10B $60,000 = 2.0: 1 $30,000 Working capital = $60,000 โ€“ $30,000 = $30,000 (a) Current ratio = $42,000* = 3.5 : 1 $12,000** Working capital = $42,000 โ€“ $12,000 = $30,000 (b) Current ratio = *$60,000 โ€“ $18,000 **$30,000 โ€“ $18,000 (c) Liquidity measures indicate a companyโ€™s ability to pay current obligations as they become due. Satisfaction of current obligations usually requires the use of current assets. If a company has more current assets than current liabilities it is more likely that it will meet obligations as they become due. Since working capital and the current ratio compare current assets to current liabilities, both are measures of liquidity. Kimmel, Financial Accounting, 7/e Exercise B 2-9 EXERCISE 2-10B (Continued) Payment of current obligations frequently requires cash. Neither working capital nor the current ratio indicate the composition of current assets. If a companyโ€™s current assets are largely comprised of items such as inventory and prepaid expenses it may have difficulty paying current obligations even though its working capital and current ratio are large enough to indicate favorable liquidity. In Abrevโ€™s case, payment of $18,000 of accounts payable will leave only $17,000 cash. Since salaries payable will require $12,000, the company may need to borrow in order to make the required payment for salaries. (d) The CFOโ€™s decision to use $18,000 of cash to pay off accounts payable is not in itself unethical. However doing so just to improve the year-end current ratio could be considered unethical if this action misled creditors. Since the CFO requested preparation of a โ€œpreliminaryโ€ balance sheet before deciding to pay off the liabilities he seems to be โ€œmanagingโ€ the companyโ€™s financial position which is usually considered unethical. EXERCISE 2-11B 2014 2013 (a) Current ratio $1,020,834 = 2.71:1 $376,178 $1,189,108 = 2.56:1 $464,618 (b) Earning per share $400,019 = $1.85 $216,119 $387,359 = $1.74 $222,662 (c) Debt to assets ratio $527,216 = 28.2% $1,867,680 $562,246 = 28.4% $1,979,558 (d) Free cash flow $464,270 โ€“ $250,407 โ€“ $80,796 = $133,067 $749,268 โ€“ $225,939 โ€“ $61,521 = $461,808 (e) Using the debt to assets ratio and free cash flow as measures of solvency produces negative results for American Eagle Outfitters. Its debt to assets ratio decreased slightly from 28.4% for 2013 to 28.2% for 2014 indicating a very small increase in solvency for 2014. Its free cash flow decreased by 71% indicating a significant decline in solvency. 2-10 Kimmel, Accounting, 5/e, Exercise B/Problem Set C EXERCISE 2-11B (Continued) (f) In both 2014 and 2013 American Eagle Outfittersโ€™s cash provided by operating activities was greater than the cash used for capital expenditures. It is generating plenty of cash from operations to cover its investing needs. This is not unusual for a company that has been operating successfully for more than ten years, as has been the case with American Eagle Outfitters. If it faced a deficiency, it could meet it by issuing stock or debt. Kimmel, Financial Accounting, 7/e Exercise B 2-11 EXERCISE 2-12B (a) (b) (c) (d) (e) (f) 2 6 3 4 5 1 Going concern assumption Economic entity assumption Monetary unit assumption Periodicity assumption Historical cost principle Full disclosure principle EXERCISE 2-13B 1. Incorrect. The historical cost principle requires that assets be recorded and reported at their cost. 2. Correct. The monetary unit assumption assumes the unit of measure remains sufficiently constant over time. 3. Incorrect. The economic entity assumption requires that the activities of the entity be kept separate and distinct from the activities of its owner and all other economic entities. 2-12 Kimmel, Accounting, 5/e, Exercise B/Problem Set C SOLUTIONS TO PROBLEMSโ€”SET C PROBLEM 2-1C KELLOGG COMPANY Balance Sheet December 31, 2014 (in millions) Assets Current assets Cash . …………………………………………………………… Accounts receivable, net . …………………………….. Inventory . …………………………………………………….. Prepaid insurance . ……………………………………….. Total current assets . ……………………………… 2,558 Property, plant, and equipment Equipment . …………………………………………………… 3,870 Less: Accumulated depreciationโ€” equipment. …………………………………………… Intangible assets Goodwill . ……………………………………………………… Total assets. ………………………………………….. $ 334 1,093 910 221 $ 860 Liabilities and Stockholdersโ€™ Equity Current liabilities Notes ………………………………. $ Totalpayableโ€”current current liabilities . ………………………….. 1,211 2,288 Accounts payable . ……………………………………….. 1,077 Long-term liabilities Notes payableโ€”noncurrent . …………………………. Total long-term liabilities . ……………………… 4,835 Total Bondsliabilities payable………………………………………………. ……………………………………………. 1,802 8,925 Stockholdersโ€™ equity Common stock . ……………………………………………. Total stockholdersโ€™ equity 577 . ……………………. Retained earnings 1,698 Total liabilities and. ……………………………………….. stockholdersโ€™ equity . ……… Kimmel, Financial Accounting, 7/e Exercise B 3,010 5,632 $11,200 $ 6,637 2,275 $11,200 2-13 PROBLEM 2-2C TILLEY, INC. Income Statement For the Year Ended December 31, 2014 Revenues Service revenue . ……………………………………………. $53,000 Expenses Salaries and wages expense . …………………………. $36,000 Depreciation expense . …………………………………… 4,300 Maintenance and repairs expense . …………………. 2,600 Utilities expense . …………………………………………… 2,100 Insurance expense . ……………………………………….. 1,800 TILLEY, INC. Total expenses . ………………………………………. Retained Earnings Statement Net income . ………………………………………………………….. For the Year Ended December 31, 2014 6,200 Retained earnings, January 1 . ………………………………. Plus: Net income . ………………………………………………… Less: Dividends . ………………………………………………….. Retained earnings, December 31. ………………………….. 2-14 Kimmel, Accounting, 5/e, Exercise B/Problem Set C 46,800 $ $14,000 6,200 20,200 2,600 $17,600 PROBLEM 2-2C (Continued) TILLEY, INC. Balance Sheet December 31, 2014 Assets Current assets Cash . $ 5,100 Accounts receivable . 4,900 Total current assets . ……………………………… Prepaid insurance . $11,400 1,400 Property, plant, and equipment 8,600 Equipment . …………………………………………………… Total assets . ………………………………………………… 31,000 Less: Accumulated depreciation – equipment . Liabilities and Stockholdersโ€™ Equity Current liabilities Accounts payable . ……………………………………….. $8,200 Salaries and wages payable . ………………………… 2,000 Total current liabilities . ………………………….. $10,200 Stockholdersโ€™ equity Common stock . ……………………………………………. 6,000 Retained earnings . ……………………………………….. 17,600 Total stockholdersโ€™ equity . ……………………. 23,600 Total liabilities and stockholdersโ€™ equity . ……… $33,800 Kimmel, Financial Accounting, 7/e Exercise B 22,400 $33,800 2-15 PROBLEM 2-3C (a) RAPP CORPORATION Income Statement For the Year Ended April 30, 2014 Revenues Sales revenue . ……………………………………….. $21,450 Expenses Salaries and wages expense . …………………. $6,840 Depreciation expense . ……………………………. 2,200 Income tax expense . ………………………………. 1,600 Rent expense . ………………………………………… 760 CORPORATION Interest expense .RAPP ……………………………………. Retained Earnings Statement Total expenses . ……………………………….. the Year Ended April 30, 2014 Net incomeFor . ……………………………………………. 9,700 Retained earnings, May 1, 2013 . …………………….. Plus: Net income . ………………………………………… Less: Dividends . …………………………………………… Retained earnings, April 30, 2014. ………………….. 2-16 Kimmel, Accounting, 5/e, Exercise B/Problem Set C 350 11,750 $ $13,960 9,700 23,660 2,800 $20,860 PROBLEM 2-3C (Continued) (b) RAPP CORPORATION Balance Sheet April 30, 2014 Assets Current assets Cash . ……………………………………………………… Accounts receivable . ……………………………… Prepaid rent . ………………………………………….. Total current assets . ……………………… $31,485 Equipment . …………………………………………………… Less: Accumulated depreciationโ€”equipment .. 17,650 Total assets. …………………………………………… $21,955 9,150 380 24,250 6,600 $49,135 Liabilities and Stockholdersโ€™ Equity Current liabilities Accounts payable . …………………………………. 2,100 Total current liabilities. ………………….. 2,575Income taxes payable . ……………………………. 300 Notes payable . ……………………………………………… Interest payable . …………………………………….. Total liabilities . ……………………………… 175 8,275 $ Stockholdersโ€™ equity Total stockholdersโ€™ equity . ……………. Common stock . ……………………………………… Total liabilities and20,000 stockholdersโ€™ equity . ………………………………………… Retained earnings . …………………………………. 20,860 (c) $ 5,700 40,860 $49,135 Rapp Corporation reports its revenues and expenses on the income statement with net income being the result. Net income from the income statement is reported on the retained earnings statement as an item added to beginning retained earnings as part of the determination of retained earnings at year end. The year end retained earnings is then reported as part of stockholdersโ€™ equity on the balance sheet. Kimmel, Financial Accounting, 7/e Exercise B 2-17 PROBLEM 2-4C (a) Weberโ€™s net income is $136,000 ($890,000๏€ โ€“๏€ $620,000๏€ โ€“๏€ $59,000 โ€“ $10,000 โ€“ $65,000). Its earnings per share is $.34 ($136,000 รท 400,000 shares). Al Sharifโ€™s net income is $44,000 ($450,000 โ€“ $260,000 โ€“ $130,000 โ€“ $6,000 โ€“ $10,000). Its earnings per share is $.22 ($44,000 รท 200,000 shares). (b) Weberโ€™s 2014 working capital of $400,000 ($700,000 โ€“ $300,000) is over 3 times as high as Al Sharifโ€™s working capital of $105,000 ($180,000 โ€“ $75,000). However, Weberโ€™s 2014 current ratio of 2.3:1 ($700,000 รท $300,000) is slightly lower than Al Sharifโ€™s current ratio of 2.4:1 ($180,000 รท $75,000). (c) Al Sharif appears to be less solvent. Al Sharifโ€™s 2014 debt to assets ratio of 34% ($265,000 รท $780,000)a is slightly higher than Weberโ€™s ratio of 33% ($500,000 รท $1,500,000)b. The lower the percentage of debt to assets, the lower the risk that a company may be unable to pay its debts as they come due. Al Sharifโ€™s free cash flow is only $22,000 ($46,000 โ€“ $20,000 โ€“ $4,000) compared to $115,000 ($180,000 โ€“ $50,000 โ€“ $15,000) for Weber. More free cash flow indicates that Weber will be better able to finance more capital expenditures without taking on more debt. a $265,000 ($75,000 + $190,000) is Al Sharifโ€™s 2014 total liabilities. $780,000 ($180,000 + $600,000) is Al Sharifโ€™s 2014 total assets. b $500,000 ($300,000 + $200,000) is Weberโ€™s 2014 total liabilities. $1,500,000 ($700,000 + $800,000) is Weberโ€™s 2014 total assets. 2-18 Kimmel, Accounting, 5/e, Exercise B/Problem Set C PROBLEM 2-5C (a) (i) Current ratio = $298,600 = 2.0:1. $148,700 (ii) Working capital = $298,600 โ€“ $148,700 = $149,900. (iii) Debt to assets ratio = $258,700 = 34%. $763,900 (iv) Free cash flow = $71,300 โ€“ $42,000 โ€“ $10,000 = $19,300. (v) Earnings per share = $99,200 = $1.53. 65,000 (b) During 2014, DeVoeโ€™s current ratio decreased from 2.4:1 to 2.0:1 and its working capital dropped from $178,000 to $149,900. Both measures indicate a slight decline in liquidity during 2014. DeVoeโ€™s debt to assets ratio increased from 31% in 2013 to 34% in 2014 indicating that the company is less solvent in 2014. Using another measure of solvency, free cash flow, we see that DeVoeโ€™s solvency has improved during 2014. Earnings per share increased from $1.35 to $1.53 in 2014. This 13% increase indicates better profitability in 2014. Kimmel, Financial Accounting, 7/e Exercise B 2-19 PROBLEM 2-6C 2013 2014 (a) Earnings per share. $163,000 = $.51 320,000 shares $150,000 = $.41 370,000 shares (b) Working capital. ($24,000 + $55,000 + $73,000) โ€“ $65,000 = $87,000 ($40,000 + $90,000 + $74,000) โ€“ $88,000 = $116,000 (c) Current ratio. $152,000 = 2.34:1 $65,000 $204,000 = 2.32:1 $88,000 (d) Debt to assets. $135,000 = 21.8% $619,000 (e) Free cash flow. $178,000 โ€“ $45,000 โ€“ $43,000 = $90,000 $178,000 = 22.2% $802,000 Free cash flow. $165,000 โ€“ $85,000 โ€“ $50,000 = $30,000 (f) The underlying profitability of the corporation as measured by earnings per share has declined. The liquidity of the corporation dropped as shown by the increase in working capital and the slight decrease current ratio. Also, the corporation appears to be increasing its debt burden as its debt to assets increased slightly indicating a decrease in solvency. Comparing free cash flow, we find a drop in this measure of solvency also. 2-20 Kimmel, Accounting, 5/e, Exercise B/Problem Set C PROBLEM 2-7C Ratio Blockbuster Inc Movie Gallery, Inc. (All Dollars Are in Millions) (a) Working capital $171 ($1,566 โ€“ $1,395) ($29) ($239 โ€“ $268) (b) Current ratio 1.12:1 ($1,566 รท $1,395) .89:1 ($239 รท $268) (c) Debt to assets ratio 71.6% ($2,246 รท $3,137) 120.6% ($1,390 รท $1,153) (d) Free cash flow $329 โ€“ $79 โ€“ $11 = $239 ($10) โ€“ $20 โ€“ $0 = ($30) (e) Earnings (Loss) per share $0.29 = $55 โ€“ 0 189.0 (f) ($0.82) = ($26) โ€“ 0 31.8 The comparison of the two companies shows the following: Liquidityโ€”Blockbusterโ€™s current ratio is 1.12:1 compared to Movie Galleryโ€™s .89:1. Its working capital is $171 compared to Movie Galleryโ€™s negative $29. Blockbuster is much more liquid than Movie Gallery using either indicator. Solvencyโ€”Blockbuster is more solvent than Movie Gallery because its ratio of debt to assets is significantly lower and its free cash flow is much larger. Profitabilityโ€”Blockbuster reported a net income while Movie Gallery reported a net loss. Therefore, Blockbusters is more profitable. Kimmel, Financial Accounting, 7/e Exercise B 2-21 PROBLEM 2-8C (a) The primary objective of financial reporting is to provide information useful for decision making. Since Net Nannyโ€™s shares appear to be actively traded, investors must be capable of using the information made available by Net Nanny to make decisions about the company. (b) The investors must feel as if the company will show earnings in the future. They must recognize that information relevant to their investment choice is indicated by more than Net Nannyโ€™s net income. (c) The change from Canadian dollars to U.S. dollars for reporting purposes should make Net Nanny more comparable with companies traded on U.S. stock exchanges. 2-22 Kimmel, Accounting, 5/e, Exercise B/Problem Set C Continuing Cookie Chronicle 1 Continuing Cookie Chronicle (Note: This is a continuation of the Cookie Chronicle from Chapter 1.) CCC2 After investigating the different forms of business organization, Natalie Koebel decides to operate her business as a corporation, Cookie Creations Inc., and she begins the process of getting her business running. While at a trade show, Natalie is introduced to Gerry Richards, operations manager of โ€œBiscuits,โ€ a national food retailer. After much discussion, Gerry asks Natalie to consider being Biscuitsโ€™ major supplier of oatmeal chocolate chip cookies. He provides Natalie with the most recent copy of the financial statements of Biscuits. He expects that Natalie will need to supply Biscuitsโ€™ Watertown warehouse with approximately 1,500 dozen cookies a week. Natalie is to send Biscuits a monthly invoice, and she will be paid approximately 30 days from the date the invoice is received in Biscuitsโ€™ Chicago office. Natalie is thrilled with the offer. However, she has recently read in the newspaper that Biscuits has a reputation for selling cookies and donuts with high amounts of sugar and fat, and as a result, consumer demand for the companyโ€™s products has decreased. Instructions Natalie has several questions. Answer the following questions for Natalie. (a) What type of information does each financial statement provide? (b) What financial statements would Natalie need in order to evaluate whether Biscuits will have enough cash to meet its current liabilities? Explain what to look for. (c) What financial statements would Natalie need in order to evaluate whether Biscuits will be able to survive over a long period of time? Explain what to look for. (d) What financial statement would Natalie need in order to evaluate Biscuitsโ€™ profitability? Explain what to look for. (e) Where can Natalie find out whether Biscuits has outstanding debt? How can Natalie determine whether Biscuits would be able to meet its interest and debt payments on any debts it has? (f) How could Natalie determine whether Biscuits pays a dividend? (g) In deciding whether to go ahead with this opportunity, are there other areas of concern that Natalie should be aware of? Exercises set B 5 Exercises: Set B E2-1B Classify accounts on balance sheet. The following are the major balance sheet classifications. Current assets (CA) Long-term investments (LTI) Property, plant, and equipment (PPE) Intangible assets (IA) Current liabilities (CL) Long-term liabilities (LTL) Common stock (CS) Retained earnings (RE) (LO 1), AP Instructions Classify each of the following financial statement items taken from Inshore Corporationโ€™s balance sheet. ____ Accounts payable ____ Accounts receivable ____ Accumulated depreciationโ€” buildings ____ Buildings ____ Cash ____ Interest receivable ____ Goodwill ____ Notes payable E2-2B ____ Inventory ____ Stock investments (to be sold in 18 months) ____ Land ____ Mortgage payable ____ Supplies ____ Equipment ____ Prepaid rent The major balance sheet classifications are listed in E2-1B above. Instructions Classify each of the following financial statement items based upon the major balance sheet classifications listed in E2-1B. ____ Prepaid rent ____ Equipment ____ Copyrights ____ Salaries and wages payable ____ Income taxes payable ____ Retained earnings ____ Accounts receivable ____ Land (LO 1), AP ____ Patents ____ Bonds payable ____ Common stock ____ Accumulated depreciationโ€” equipment ____ Unearned sales revenue ____ Inventory E2-3B Suppose the following items were taken from the December 31, 2014, assets section of the Boeing Company balance sheet. (All dollars are in millions.) Inventory $ 9,563 Notes receivableโ€”due after December 31, 2015 6,777 Notes receivableโ€”due before December 31, 2015 328 Accumulated depreciationโ€”buildings 11,915 Classify financial statement items by balance sheet classification. Patents Buildings Cash Accounts receivable Debt investments (short-term) $16,664 20,180 7,042 5,740 2,266 Classify items as current or noncurrent, and prepare assets section of balance sheet. (LO 1) Instructions Prepare the assets section of a classified balance sheet, listing the current assets in order of their liquidity. E2-4B Suppose the following information (in thousands of dollars) is available for H. J. Heinz Companyโ€”famous for ketchup and other fine food productsโ€”for the year ended April 30, 2014. Prepaid insurance Land Goodwill Trademarks Inventory $ 168,182 56,007 4,411,521 723,243 1,378,216 Buildings Cash Accounts receivable Accumulated depreciationโ€” buildings $4,344,269 617,687 1,161,481 2,295,563 Instructions Prepare the assets section of a classified balance sheet, listing the items in proper sequence and including a statement heading. Prepare assets section of a classified balance sheet. (LO 1) 6 chapter 2 A Further Look at Financial Statements Prepare a classified balance sheet. E2-5B 2014. (LO 1), AP These items are taken from the financial statements of Trotter Co. at December 31, Buildings Accounts receivable Prepaid insurance Cash Equipment Land Insurance expense Depreciation expense Interest expense Common stock Retained earnings (January 1, 2014) Accumulated depreciationโ€”buildings Accounts payable Notes payable Accumulated depreciationโ€”equipment Interest payable Service revenue $115,800 10,600 3,200 18,840 82,400 61,200 780 5,300 2,600 75,000 40,000 45,600 9,500 93,600 18,720 3,600 14,700 Instructions Prepare a classified balance sheet. Assume that $13,600 of the note payable will be paid in 2015. Prepare a classified balance sheet. (LO 1), AP E2-6B Suppose the following items were taken from the 2014 financial statements of Texas Instruments, Inc. (All dollars are in millions.) Common stock $2,671 Accumulated depreciationโ€”equipment $3,959 Prepaid rent 834 Accounts payable 1,368 Equipment 7,568 Patents 1,873 Income taxes payable 657 Notes payable (long-term) 667 Stock investments (long-term) 267 Retained earnings 7,304 Debt investments (short-term) 1,596 Accounts receivable 1,742 Cash 1,328 Inventory 1,418 Instructions Prepare a classified balance sheet in good form as of December 31, 2014. Compute and interpret profitability ratio. E2-7B Suppose the following information is available for Callaway Golf Company for the years 2014 and 2013. (Dollars are in thousands, except share information.) (LO 2), AP 2014 Net sales Net income (loss) Total assets $ 967,656 (18,804) 884,979 2013 $ 950,799 (15,260) 875,930 Share information Shares outstanding at year-end Preferred dividends 64,406,000 โ€“0โ€“ 64,473,000 โ€“0โ€“ There were 64,507,000 shares outstanding at the end of 2012. Instructions (a) What was the companyโ€™s earnings (loss) per share for each year? (b) Based on your findings above, how did the companyโ€™s profitability change from 2013 to 2014? (c) Suppose the company had paid dividends on preferred stock and on common stock during the year. How would this affect your calculation in part (a)? Prepare financial statements. (LO 1, 3, 4), AP E2-8B 2014. These financial statement items are for Wi-HAUL Corporation at year-end, July 31, Salaries and wages payable Salaries and wages expense Supplies expense Equipment Accounts payable $ 2,080 57,500 17,600 17,500 4,100 Exercises set B Service revenue Rent revenue Notes payable (due in 2017) Common stock Cash Accounts receivable Accumulated depreciationโ€”equipment Dividends Depreciation expense Retained earnings (beginning of the year) 7 $66,100 8,500 1,800 16,000 26,200 11,780 6,000 4,000 4,000 34,000 Instructions (a) Prepare an income statement and a retained earnings statement for the year. Wi-HAUL Corporation did not issue any new stock during the year. (b) Prepare a classified balance sheet at July 31. (c) Compute the current ratio and debt to assets ratio. (d) Suppose that you are the president of Crescent Equipment. Your sales manager has approached you with a proposal to sell $20,000 of equipment to Wi-HAUL. He would like to provide a loan to Wi-HAUL in the form of a 10%, 5-year note payable. Evaluate how this loan would change Wi-HAULโ€™s current ratio and debt to assets ratio, and discuss whether you would make the sale. E2-9B Nordstrom, Inc. operates department stores in numerous states. Selected financial statement data (in millions of dollars) for a recent year are as follows. End of Year Beginning of Year Cash and cash equivalents Receivables (net) Merchandise inventory Other current assets $ 358 1,788 956 259 $ 403 684 997 658 Total current assets Total current liabilities $3,361 $1,635 $2,742 $1,433 Compute liquidity ratios and compare results. (LO 4), AP Instructions (a) Compute working capital and the current ratio at the beginning of the year and at the end of the current year. (b) Did Nordstromโ€™s liquidity improve or worsen during the year? (c) Using the data in the chapter, compare Nordstromโ€™s liquidity with Best Buyโ€™s. E2-10B The chief financial officer (CFO) of Abrev Corporation requested that the accounting department prepare a preliminary balance sheet on December 30, 2014, so that the CFO could get an idea of how the company stood. He knows that certain debt agreements with its creditors require the company to maintain a current ratio of at least 2:1. The preliminary balance sheet is as follows. Compute liquidity measures and discuss findings. (LO 4), AP ABREV CORP. Balance Sheet December 30, 2014 Current assets Cash Accounts receivable Prepaid insurance Equipment (net) Total assets $35,000 20,000 5,000 $ 60,000 200,000 $260,000 Current liabilities Accounts payable Salaries and wages payable Long-term liabilities Notes payable Total liabilities Stockholdersโ€™ equity Common stock Retained earnings Total liabilities and stockholdersโ€™ equity Instructions (a) Calculate the current ratio and working capital based on the preliminary balance sheet. $ 18,000 12,000 $ 30,000 80,000 110,000 100,000 50,000 150,000 $260,000 8 chapter 2 A Further Look at Financial Statements (b) Based on the results in (a), the CFO requested that $18,000 of cash be used to pay off the balance of the accounts payable account on December 31, 2014. Calculate the new current ratio and working capital after the company takes these actions. (c) Discuss the pros and cons of the current ratio and working capital as measures of liquidity. (d) Was it unethical for the CFO to take these steps? Compute and interpret solvency ratios. E2-11B Suppose the following data were taken from the 2014 and 2013 financial statements of American Eagle Outfitters. (All dollars are in thousands.) (LO 4, 5), AP Current assets Total assets Current liabilities Total liabilities Net income Net cash provided by operating activities Capital expenditures Dividends paid on common stock Weighted-average shares outstanding 2014 2013 $1,020,834 1,867,680 376,178 527,216 400,019 464,270 250,407 80,796 216,119 $1,189,108 1,979,558 464,618 562,246 387,359 749,268 225,939 61,521 222,662 Instructions Perform each of the following. (a) Calculate the current ratio for each year. (b) Calculate earnings per share for each year. (c) Calculate the debt to assets ratio for each year. (d) Calculate the free cash flow for each year. (e) Discuss American Eagleโ€™s solvency in 2014 versus 2013. (f) Discuss American Eagleโ€™s ability to finance its investment activities with cash provided by operating activities, and how any deficiency would be met. Identify accounting assumptions and principles. (LO 7), K E2-12B Presented below are the assumptions and principles discussed in this chapter. 1. Full disclosure principle. 2. Going concern assumption. 3. Monetary unit assumption. 4. Periodicity assumption. 5. Historical cost principle. 6. Economic entity assumption. Instructions Identify by number the accounting assumption or principle that is described below. Do not use a number more than once. โ€”โ€”โ€” (a) Is the rationale for why plant assets are not reported at liquidation value. (Note: Do not use the historical cost principle.) โ€”โ€”โ€” (b) Indicates that personal and business record-keeping should be separately maintained. โ€”โ€”โ€” (c) Assumes that the dollar is the โ€œmeasuring stickโ€ used to report on financial performance. โ€”โ€”โ€” (d) Separates financial information into time periods for reporting purposes. โ€”โ€”โ€” (e) Indicates that companies should not record in the accounts fair value changes subsequent to purchase. โ€”โ€”โ€” (f ) Dictates that companies should disclose all circumstances and events that make a difference to financial statement users. Identify the assumption or principle that has been violated. (LO 7), C E2-13B The following situations involve accounting principles and assumptions. 1. Donkey Company owns land that is worth substantially more than it originally cost. In an effort to provide more relevant information. Donkey reports the land at market value in its accounting reports. 2. Benjamin Company includes in its accounting records only transaction data that can be expressed in terms of money. 3. Josh Borke, owner of Joshโ€™s MovieHouse, records his personal living costs as expenses of the MovieHouse. Instructions For each of the three situations, say if the accounting method used is correct or incorrect. If correct, identify which principle or assumption supports the method used. If incorrect, identify which principle or assumption has been violated. Problems: Set C 3 Problems: Set C P2-1C Suppose the following items are from the 2014 balance sheet of Kellogg Company. (All dollars are in millions.) Common stock Accumulated depr.โ€”equipment Notes payableโ€”current Prepaid insurance Cash Bonds payable Retained earnings Accounts payable Accounts receivable, net Equipment Inventory Notes payableโ€”noncurrent Goodwill $ 577 860 1,211 221 334 1,802 1,698 1,077 1,093 3,870 910 4,835 5,632 Instructions Prepare a classified balance sheet for Kellogg Company as of December 31, 2014. P2-2C These items are taken from the financial statements of Tilley, Inc. Prepaid insurance Equipment Salaries and wages expense Utilities expense Accumulated depreciationโ€”equipment Accounts payable Cash Accounts receivable Salaries and wages payable Common stock Depreciation expense Retained earnings (beginning) Dividends Service revenue Maintenance and repairs expense Insurance expense $ 1,400 31,000 36,000 2,100 8,600 8,200 5,100 $ 4,900 2,000 6,000 4,300 14,000 2,600 53,000 2,600 1,800 Instructions Prepare an income statement, a retained earnings statement, and a classified balance sheet as of December 31, 2014. P2-3C You are provided with the following information for Rapp Corporation, effective as of its April 30, 2014, year-end. Accounts payable Accounts receivable Accumulated depreciationโ€”equipment Depreciation expense Cash Common stock Dividends Equipment Sales revenue Income tax expense Income taxes payable Interest expense Interest payable Notes payable (due in 2018) Prepaid rent Rent expense Retained earnings, beginning Salaries and wages expense $ 2,100 9,150 6,600 2,200 21,955 20,000 2,800 24,250 21,450 1,600 300 350 175 5,700 380 760 13,960 6,840 Prepare a classified balance sheet. (LO 1), AP Tot. current assets Tot. assets $2,558 $11,200 Prepare financial statements. (LO 1, 3), AP Net income Tot. assets $6,200 $33,800 Prepare financial statements. (LO 1, 3), AP 4 chapter 2 A Further Look at Financial Statements Net income Tot. current assets Tot. assets $9,700 $31,485 $49,135 Compute ratios; comment on relative profitability, liquidity, and solvency. Instructions (a) Prepare an income statement and a retained earnings statement for Rapp Corporation for the year ended April 30, 2014. (b) Prepare a classified balance sheet for Rapp as of April 30, 2014. (c) Explain how each financial statement interrelates with the others. P2-4C Comparative statement data for Al Sharif Company and Weber Company, two competitors, are presented below. All balance sheet data are as of December 31, 2014. Al Sharif Company (LO 2, 4, 5), AN Weber Company 2014 2014 Net sales Cost of goods sold Operating expenses Interest expense Income tax expense Current assets Plant assets (net) Current liabilities Long-term liabilities Net cash provided by operating activities Capital expenditures Dividends paid $450,000 260,000 130,000 6,000 10,000 180,000 600,000 75,000 190,000 46,000 20,000 4,000 $890,000 620,000 59,000 10,000 65,000 700,000 800,000 300,000 200,000 180,000 50,000 15,000 Average number of shares outstanding 200,000 400,000 Instructions (a) Compute the net income and earnings per share for each company for 2014. (b) Comment on the relative liquidity of the companies by computing working capital and the current ratio for each company for 2014. (c) Comment on the relative solvency of the companies by computing the debt to assets ratio and the free cash flow for each company for 2014. Compute and interpret liquidity, solvency, and profitability ratios. P2-5C The financial statements of DeVoe Company are presented here. DEVOE COMPANY Income Statement For the Year Ended December 31, 2014 (LO 2, 4, 5), AP Net sales Cost of goods sold Selling and administrative expenses Interest expense Income tax expense $700,000 400,000 150,000 7,800 43,000 Net income $ 99,200 DEVOE COMPANY Balance Sheet December 31, 2014 Assets Current assets Cash Debt investments Accounts receivable (net) Inventory $ 18,100 34,800 90,700 155,000 Total current assets 298,600 Plant assets (net) 465,300 Total assets $763,900 Problems: Set C Liabilities and Stockholdersโ€™ Equity Current liabilities Accounts payable Income taxes payable $119,700 29,000 Total current liabilities 148,700 Bonds payable 110,000 Total liabilities 258,700 Stockholdersโ€™ equity Common stock Retained earnings 170,000 335,200 Total stockholdersโ€™ equity 505,200 Total liabilities and stockholdersโ€™ equity $763,900 Net cash provided by operating activities Capital expenditures Dividends paid Average number of shares outstanding $ 71,300 $ 42,000 $ 10,000 65,000 Instructions (a) Compute the following values and ratios for 2014. (We provide the results from 2013 for comparative purposes.) (i) Current ratio. (2013: 2.4:1) (ii) Working capital. (2013: $178,000) (iii) Debt to assets ratio. (2013: 31%) (iv) Free cash flow. (2013: $13,000) (v) Earnings per share. (2013: $1.35) (b) Using your calculations from part (a), discuss changes from 2013 in liquidity, solvency, and profitability. P2-6C Condensed balance sheet and income statement data for Fellenz Corporation are presented below. FELLENZ CORPORATION Balance Sheets December 31 Assets (LO 2, 4, 5), AP 2014 2013 Cash Receivables (net) Other current assets Long-term investments Plant and equipment (net) $ 40,000 90,000 74,000 78,000 520,000 $ 24,000 55,000 73,000 60,000 407,000 Total assets $802,000 $619,000 Liabilities and Stockholdersโ€™ Equity Compute and interpret liquidity, solvency, and profitability ratios. 2014 2013 Current liabilities Long-term debt Common stock Retained earnings $ 88,000 90,000 370,000 254,000 $ 65,000 70,000 320,000 164,000 Total liabilities and stockholdersโ€™ equity $802,000 $619,000 FELLENZ CORPORATION Income Statements For the Years Ended December 31 2014 2013 Sales revenue Cost of goods sold Operating expenses (including income taxes) $770,000 420,000 200,000 $800,000 400,000 237,000 Net income $150,000 $163,000 5 6 chapter 2 A Further Look at Financial Statements Net cash provided by operating activities Cash used for capital expenditures Dividends paid $165,000 85,000 50,000 $178,000 45,000 43,000 Average number of shares outstanding 370,000 320,000 Instructions Compute the following values and ratios for 2013 and 2014. (a) Earnings per share. (b) Working capital. (c) Current ratio. (d) Debt to assets ratio. (e) Free cash flow. (f ) Based on the ratios calculated, discuss briefly the improvement or lack thereof in the financial position and operating results of Fellenz from 2013 to 2014. Compute ratios and compare liquidity, solvency, and profitability for two companies. P2-7C Selected financial data of two competitors, Blockbuster Inc. and Movie Gallery, Inc., in a recent year are presented below. (All dollars are in millions.) (LO 2, 4, 5), AP Blockbuster Inc. Movie Gallery, Inc. Income Statement Data for Year Net sales Cost of goods sold Selling and administrative expenses Interest expense Other expense Income tax expense (refund) $ 5,524 2,476 2,755 102 212 (76) $2,542 1,012 1,431 120 3 2 Net income (loss) $ $ (26) 55 Blockbuster Inc. Movie Gallery, Inc. Balance Sheet Data (End of Year) Current assets Property, plant, and equipment (net) Intangible assets $ 1,566 736 835 $ 239 243 671 Total assets $ 3,137 $1,153 Current liabilities Long-term liabilities Total stockholdersโ€™ equity $ 1,395 851 891 $ 268 1,122 (237) Total liabilities and stockholdersโ€™ equity $ 3,137 $1,153 Net cash provided by operating activities Cash used for capital expenditures Dividends paid $329 79 11 $(10) 20 โ€“0โ€“ Average shares outstanding 189.0 31.8 Instructions For each company, compute these values and ratios. (a) Working capital. (b) Current ratio. (Round to two decimal places.) (c) Debt to assets ratio. (d) Free cash flow. (e) Earnings per share. (f ) Compare the liquidity, profitability, and solvency of the two companies. Comment on the objectives and qualitative characteristics of accounting information. (LO 6, 7), E P2-8C Net Nanny Software International Inc., headquartered in Vancouver, specializes in Internet safety and computer security products for both the home and commercial markets. In a recent balance sheet, it reported a deficit (negative retained earnings) of US $5,678,288. It has reported only net losses since its inception. In spite of these losses, Problems: Set C Net Nannyโ€™s common shares have traded anywhere from a high of $3.70 to a low of $0.32 on the Canadian Venture Exchange. Net Nannyโ€™s financial statements have historically been prepared in Canadian dollars. Recently, the company adopted the U.S. dollar as its reporting currency. Instructions (a) What is the objective of financial reporting? How does this objective meet or not meet Net Nannyโ€™s investorsโ€™ needs? (b) Why would investors want to buy Net Nannyโ€™s shares if the company has consistently reported losses over the last few years? Include in your answer an assessment of the relevance of the information reported on Net Nannyโ€™s financial statements. (c) Comment on how the change in reporting information from Canadian dollars to U.S. dollars likely affected the readers of Net Nannyโ€™s financial statements. Include in your answer an assessment of the comparability of the information. 7 CHAPTER 2 A Further Look at Financial Statements Learning Objectives 1. Identify the sections of a classified balance sheet. 2. Identify tools for analyzing financial statements and compute ratios for analyzing a companyโ€™s profitability. 3. Explain the relationship between a retained earnings statement and a statement of stockholdersโ€™ equity. 4. Identify and compute ratios for analyzing a companyโ€™s liquidity and solvency using a balance sheet. 5. Use the statement of cash flows to evaluate solvency. 6. Explain the meaning of generally accepted accounting principles. 7. Discuss financial reporting concepts. Kimmel, Accounting, 5/e, Instructorโ€™s Manual 2-1 Chapter Outline Learning Objective 1 – Identify the Sections of a Classified Balance Sheet. In a classified balance sheet, companies often group similar assets and similar liabilities together using standard classifications and sections. This is useful because items within the groups have similar economic characteristics. The groupings help users determine: (1) whether the company has enough assets to pay its debts and (2) what claims by short-and long-term creditors exist on the companyโ€™s total assets. A classified balance sheet generally contains the following standard classifications: ๏‚จ Current Assets ๏‚ง Assets that are expected to be converted to cash or used up in the business within one year or one operating cycle whichever is longer. ๏‚ง Examples of current assets: cash, short-term investments (which include short-term U.S. government securities), receivables (accounts receivable, notes receivable, and interest receivable), inventories, and prepaid expenses (rent, supplies, insurance, and advertising). ๏‚ง On the balance sheet, current assets are listed in the order in which they are expected to be converted into cash (order of liquidity). ๏‚ง Some companies use a period longer than one year to classify assets and liabilities as current because they have an operating cycle longer than one year. The operating cycle of a company is the average time required to go from cash to cash in producing revenue-buy inventory, sell it, and collect the cash from the customers. TEACHING TIP (a) Discuss the difference between notes receivable and accounts receivable; different types of prepaid expenses; and the fact that inventory, supplies, and prepaid expenses will become expenses when they are used up. Explain why these assets are classified as current. (b) Discuss the concept of short-term investments. ๏‚จ Long-Term Investments ๏‚ง Assets that can be converted into cash, but whose conversion is not expected within one year. ๏‚ง These include long-term assets not currently used in the companyโ€™s operations (i.e., land, buildings, etc.) and investments in stocks and bonds of other corporations. 2-2 Kimmel, Accounting, 5/e, Instructorโ€™s Manual TEACHING TIP Explain to students that there are individuals in large companies who do nothing but take care of long-term investments. Discuss the difference between short-term and long-term investments in stocks and bonds of other corporations. Example: A homebuilder has the following assets: (1) lots in a subdivision that are ready for sale to buyers; (2) land on which the corporate office building sits; and (3) land several miles north of town on which it plans a new subdivision in 5 years. Ask students where each of these parcels of land would go on a classified balance sheet. This shows that the classification depends on the use by the company. Also, ask students how they would classify a certificate of deposit that will mature in 5 years and be used to pay for the new subdivision. ๏‚จ Property, Plant, and Equipment ๏‚ง Assets with relatively long useful lives. ๏‚ง Assets currently used in operating the business. ๏‚ง Sometimes called fixed assets or plant assets. ๏‚ง Examples include land, buildings, machinery, equipment, and furniture and fixtures. ๏‚ง Record these assets at cost and depreciate them (except land) over their useful lives. The full purchase price is not expensed in the year of purchase because the assets will be used for more than one accounting period. o Depreciation is the practice of allocating the cost of assets to a number of years. o Depreciation expense is the amount of the allocation for one accounting period. o Accumulated depreciation is the total amount of depreciation that has been expensed since the asset was placed in service. o Cost less accumulated depreciation is reported on the balance sheet. TEACHING TIP Explain that depreciation is not a valuation of assets. It is the allocation of their cost over the periods in which they will benefit the business. Many students believe the balance sheet shows the value of the business. Stress that accounting (with a few exceptions that are covered in later chapters) records cost โ€“ not value. ๏‚จ Intangible Assets ๏‚ง Noncurrent assets. ๏‚ง Assets that have no physical substance. ๏‚ง Examples are goodwill, patents, copyrights, and trademarks or trade names. TEACHING TIP Briefly discuss types of intangible assets. Encourage students to think about companies that have large investments in intangible assets. Remind students that this topic is discussed in more detail in Chapter 9. Kimmel, Accounting, 5/e, Instructorโ€™s Manual 2-3 ๏‚จ Current Liabilities ๏‚ง Obligations that are to be paid within the coming year or operating cycle whichever is longer. ๏‚ง Common examples are notes payable, accounts payable, wages payable, bank loans payable, interest payable, taxes payable, and current maturities of long-term obligations. ๏‚ง Within the current liabilities section, companies usually list notes payable first, followed by accounts payable, and then the remaining items in the order of their magnitude. TEACHING TIP (a) Discuss the following payables: wages payable, interest payable, taxes payable, etc. (b) Discuss the difference between accounts payable and notes payable. (c) Discuss how notes payable can be current or long-term, depending on the maturity date. ๏‚จ Long-Term Liabilities ๏‚ง Obligations expected to be paid after one year. ๏‚ง Liabilities in this category include bonds payable, mortgages payable, long-term notes payable, lease liabilities, and pension liabilities. ๏‚ง Many companies report long-term debt maturing after one year as a single amount in the balance sheet and show the details of the debt in notes that accompany the financial statements. TEACHING TIP Bonds have been mentioned several times. Students need to understand the difference between notes payable and bonds payable. Also discuss the difference between interest payable and notes or bonds payable. ๏‚จ Stockholdersโ€™ Equity: Stockholdersโ€™ equity consists of two parts: ๏‚ง Common Stock – investments of assets into the business by the stockholders. ๏‚ง Retained Earnings – income retained for use in the business. TEACHING TIP Tell students that companies can issue different types of stock and that common stock is sometimes referred to as capital stock. Mention that stockholdersโ€™ equity is discussed in more detail in Chapter 11. Until then, they will work with common stock. 2-4 Kimmel, Accounting, 5/e, Instructorโ€™s Manual Learning Objective 2 – Identify Tools for Analyzing Financial Statements and Ratios for Computing a Companyโ€™s Profitability. ๏‚จ Ratio analysis expresses the relationship among selected items of financial statement data. ๏‚ง A ratio expresses the mathematical relationship between one quantity and another. ๏‚ง Ratios shed light on company performance o Intracompany comparisons โ€“ covers two years for the same company o Industry-average comparisons โ€“ based on average ratios for particular industries o Intercompany comparisons โ€“ based on comparisons with a competitor in the same industry. TEACHING TIP Discuss your preference for rounding. Explain how to compute percentages. Encourage students to use a spreadsheet for computations and presentation. Also encourage them to see if their answers are reasonable and to always reflect on what the computation means โ€“ not to just make the computation and then fail to understand what it tells a user. TEACHING TIP Discuss ways for students to find industry averages and ratios from sources on the web and in the library. Encourage them to start watching shows on the financial networks and reading business periodicals as well as the business section of newspapers. Ask them to share interesting information with the class. ๏‚จ Using the Income Statement–Creditors and investors are interested in evaluating profitability. Profitability is frequently used as a test of managementโ€™s effectiveness. To supplement an evaluation of the income statement, ratio analysis is used. Profitability ratios – measure the operating success of a company for a given period of time. ๏‚ง Earnings per share o Is a profitability ratio that measures the net income earned on each share of common stock. o Is computed by dividing (net income less preferred dividends) by the average number of common shares outstanding during the year. o By comparing earnings per share of a single company over time, one can evaluate its relative earnings performance on a per share basis. o Comparisons of earnings per share across companies are not meaningful because of the wide variations in numbers of shares of outstanding stock among companies. Kimmel, Accounting, 5/e, Instructorโ€™s Manual 2-5 TEACHING TIP Ask students to watch one of the financial channels for at least 30 minutes and report on the references to earnings per share. If you use a discussion board, students can post their comments on it. This is an efficient way to share the information with the class without taking up too much classroom time. Learning Objective 3 – Explain the Relationship Between a Retained Earnings Statement and a Statement of Stockholdersโ€™ Equity. ๏‚จ Retained Earnings Statement ๏‚ง Describes the events that caused changes in the retained earnings account for the period. ๏‚ง Add net income to and subtract dividends from the beginning balance of retained earnings to arrive at the ending balance of retained earnings. ๏‚จ Statement of Stockholdersโ€™ Equity ๏‚ง Reports all changes in stockholdersโ€™ equity accounts (i.e., capital stock issued or retired). TEACHING TIP Walk through Best Buyโ€™s Statement of Stockholdersโ€™ Equity. Explain how the Statement of Stockholdersโ€™ Equity provides more information than a Retained Earnings Statement. Learning Objective 4 – Identify and Compute Ratios for Analyzing a Companyโ€™s Liquidity and Solvency Using a Balance Sheet. ๏‚จ Using A Classified Balance Sheet–An analysis of the relationship between a companyโ€™s assets and liabilities can provide users with information about the firmโ€™s liquidity and solvency. ๏‚ง Liquidity – The ability to pay obligations expected to come due within the next year or operating cycle. Two measures of liquidity include: o Working capital ๏‚ท Measure of short-term ability to pay obligations ๏‚ท Excess of current assets over current liabilities ๏‚ท Positive working capital (Current Assets > Current Liabilities) indicates the likelihood for paying liabilities is favorable. ๏‚ท Negative working capital (Current Liabilities > Current Assets) indicates that a company might not be able to pay short-term creditors and may be forced into bankruptcy. o Current ratio ๏‚ท Measure of short-term ability to pay obligations ๏‚ท Computed by dividing current assets by current liabilities ๏‚ท More dependable indicator of liquidity than working capital 2-6 Kimmel, Accounting, 5/e, Instructorโ€™s Manual ๏‚ท Does not take into account the composition of current assets (like slow-moving inventory versus cash) TEACHING TIP Explain that a 1.60:1 ratio means that for every $1 of current liabilities, the company has $1.60 in current assets. Also, students need to be aware of the fact that the composition of the assets may be very important. For example if a company had most of its current assets in cash it could be more sure of its liquidity position than another company with the majority of its current assets in inventory. What happens if the company cannot sell the inventory? ๏‚ง Solvency – The ability of a company to pay interest as it comes due and to repay the balance of debt due at its maturity. Solvency ratios include: o Debt to Total Assets Ratio ๏‚ท Measures the percentage of assets financed by creditors ๏‚ท The higher the percentage of debt financing, the riskier the company. ๏‚ท Computed by dividing total debt (both current and long-term liabilities) by total assets TEACHING TIP Compare ratios to tests performed by a doctor. Each test provides information. The doctor must ask the patient questions and then review the results of all tests before making a diagnosis. Students need to realize that ratios are indicators and must be analyzed properly before a decision can be made regarding the financial condition of a company. For example, a negative working capital does not always mean potential bankruptcy. The results of other ratios, as well as specific company information, must be analyzed. Learning Objective 5 โ€“ Use the Statement of Cash Flows to Evaluate Solvency. ๏‚จ In the statement of cash flows, cash provided by operating activities indicates the cash-generating capability of the company. However, cash provided by operating activities fails to take into account that a company must invest in new property, plant, and equipment and at least maintain dividends at current levels to satisfy investors. ๏‚ง ๏‚ง ๏‚ง Free cash flow indicates a companyโ€™s ability to generate cash from operations that is sufficient to pay debts, acquire assets, and distribute dividends. It describes the cash remaining from operations after adjusting for capital expenditures and dividends. It is computed by subtracting capital expenditures and cash dividends from cash provided by operations. Kimmel, Accounting, 5/e, Instructorโ€™s Manual 2-7 TEACHING TIP Go over the free cash flow calculation for Best Buy. Ask students to compute the free cash flow for a company and report their findings to the class. Learning Objective 6 – Explain the Meaning of Generally Accepted Accounting Principles. ๏‚จ Generally Accepted Accounting Principles (GAAP) are a set of rules and practices that provide answers to the following questions. ๏‚ง How does a company decide on the type of financial information to disclose? ๏‚ง What format should a company use? ๏‚ง How should a company measure assets, liabilities, revenues, and expenses? ๏‚จ The Securities and Exchange Commission (SEC) is a U.S. government agency that oversees U.S. financial markets and accounting standard-setting bodies. ๏‚จ The primary accounting standard-setting body in the U. S. is the Financial Accounting Standards Board (FASB). ๏‚จ The International Accounting Standards Board (IASB) sets standards called International Financial Reporting Standards (IFRS) for many countries outside the U.S. ๏‚จ The Public Company Accounting oversight Board (PCAOB) determines auditing standards and reviews the performance of auditing firms. TEACHING TIP Remind students that financial statements consist of the income statement, retained earnings statement, balance sheet, and statement of cash flows. Again, it may be good to remind them that there are internal and external users. TEACHING TIP Discuss the issue of IFRS and making different countriesโ€™ businesses more โ€œtransparent.โ€ What does transparency mean in this context? Why is this so important for successful transition to IFRS? 2-8 Kimmel, Accounting, 5/e, Instructorโ€™s Manual Learning Objective 7 โ€“ Discuss Financial Reporting Concepts. ๏‚จ Qualities of Useful Information–To be useful, information should possess two fundamental qualities: relevance and faithful representation. ๏‚ง Relevance – if information has the ability to make a difference in a decision scenario, it is relevant. Accounting information is considered relevant if it provides information that o has predictive value–helps provide accurate expectations about the future o has confirmatory value โ€“ confirms or corrects prior expectations. o an item is material when its size makes it likely to influence the decision of an investor or a creditor. TEACHING TIP When you were trying to decide what to wear to class, did it matter whether you were going to an English class or an Accounting class? No. That information was not relevant. On the other hand, when you were making the decision, the outside temperature did make a difference. Therefore, the temperature was a relevant factor. TEACHING TIP Materiality allows firms to modify GAAP. Assume a firm buys a new electric pencil sharpener that is expected to last for 6 years for $18. GAAP say that the pencil sharpener, because it is expected to last for 6 years, should be listed as an asset and depreciatedโ€”or charged offโ€” over 6 years at a rate of $3 per year. The materiality constraint allows the firm to expense the pencil sharpener immediately because the $18 expense will not make a difference to the users of financial statements. ๏‚ง Faithful Representation – information accurately depicts what really happened. To provide a faithful representation, information must be: o completeโ€”nothing important has been omitted o neutralโ€”is not biased toward one position or another o free from error TEACHING TIP Financial statements must present faithful representation to be of value. The SEC requires firms listed on an organized exchange to have financial statements audited by a Certified Public Accountant (CPA). The audit ensures faithful representation. Therefore, the public can feel more comfortable about information contained in audited financial statements. ๏‚ง Enhancing Qualities o Comparabilityโ€”when different companies use the same accounting principles. To make a comparison, companies must disclose the accounting methods used. Kimmel, Accounting, 5/e, Instructorโ€™s Manual 2-9 o Consistencyโ€”when a company uses the same accounting principles and methods from year to year o Verifiableโ€”information that is proven to be free from error. o Timelyโ€”information that is available to decision makers before it loses its capacity to influence decisions. o Understandabilityโ€”information presented in a clear fashion so that users can interpret it and comprehend its meaning. TEACHING TIP Firms must follow prescribed accounting principles if users are to compare financial statements. Consistency requires firms to be consistent in the accounting principles used. However, if there is justification for changing from one principle to another, it must be explained in the Notes to the Financial Statements. The explanation lets users know what has happened to make the difference. ๏‚จ Assumptions and Principles in Financial Reporting–To develop accounting standards, the FASB relies on the following key assumptions and principles: ๏‚ง Monetary Unit Assumption–States that only transactions expressed in money are included in accounting records. TEACHING TIP An example of a transaction expressed in terms of money would be the purchase of a building, paying the rent for the month, or paying the payroll. On the other hand, hiring an employee, ordering a product, or making a bid on a perspective job would not be a transaction expressed in terms of money. ๏‚ง Economic Entity Assumption o Every economic entity can be separately identified and accounted for. o Economic events can be identified with a particular unit of accountability. TEACHING TIP Explain to students that if they owned a bicycle shop in a nearby community, the economic transactions of the business would be kept separate from the studentsโ€™ personal transactions. ๏‚ง 2-10 Periodicity Assumption – allows the business to be divided into artificial time periods that are useful for reporting. Kimmel, Accounting, 5/e, Instructorโ€™s Manual TEACHING TIP Financial statements may be prepared monthly, quarterly, or annually, depending on the needs of the business. ๏‚ง Going Concern Assumption–Assumes the business will remain in operation for the foreseeable future TEACHING TIP Use this topic as a way to discuss some of the decisions the CPA must make about risk. What would be some of the factors that the CPA as an auditor would look for to support the going concern assumption? ๏‚จ Principles in Financial Reporting ๏‚ง Measurement Principles–GAAP generally uses one of two measurement principles: the cost principle or the fair value principle o Cost Principle โ€“ requires assets to be recorded at original cost because that amount is verifiable. o Fair value Principle โ€“ requires that assets and liabilities should be reported at fair value (the price received to sell an asset or settle a liability). TEACHING TIP Ask students to assume they just bought a delivery van for their business. The van had a sticker price of $18,000. A neighbor purchased an identical van last week for $16,500. The student gave $15,000 for the van. At which price should the van be recorded? ๏‚ง Full Disclosure Principle โ€“ requires that all circumstances and events that would make a difference to financial statement users should be disclosed. ๏‚จ Cost Constraint–Determining whether the cost that companies will incur to provide the information will outweigh the benefit that financial statement users will gain from having the information available. Kimmel, Accounting, 5/e, Instructorโ€™s Manual 2-11 IFRS ๏‚จ A Look at IFRS The classified balance sheet, although generally required internationally, contains certain variations in format when reporting under IFRS. ๏‚จ KEY POINTS ๏‚ง IFRS recommends but does not require the use of the title โ€œstatement of financial positionโ€ rather than balance sheet. ๏‚ง The format of statement of financial position information is often presented differently under IFRS. Although no specific format is required, most companies that follow IFRS present statement of financial position information in this order: o Noncurrent assets o Current assets o Equity o Noncurrent liabilities o Current liabilities IFRS requires a classified statement of financial position except in very limited situations. IFRS follows the same guidelines as this textbook for distinguishing between current and noncurrent assets and liabilities. Under IFRS, current assets are usually listed in the reverse order of liquidity. For example, under GAAP cash is listed first, but under IFRS it is listed last. Some companies report the subtotal net assets, which equals total assets minus total liabilities. See, for example, the statement of financial position of Zetar plc in Appendix C. IFRS has many differences in terminology that you will notice in this textbook. For example in the investment category stock is called shares, and in the equity section common stock is called share capital-ordinary. Both IFRS and GAAP require disclosures about (1) accounting policies followed, (2) judgments that management has made in the process of applying the entityโ€™s accounting policies, and (3) the key assumptions and estimation uncertainty that could result in a material adjustment to the carrying amounts of assets and liabilities within the next financial year. Comparative prior-period information must be presented and financial statements must be prepared annually. Both GAAP and IFRS are increasing the use of fair value to report assets. However, at this point IFRS has adopted it more broadly. As examples, under IFRS companies can apply fair value to property, plant, and equipment; natural resources; and in some cases intangible assets. Recently, the IASB and FASB completed the first phase of a jointly created conceptual framework. In this first phase, they agreed on the objective of financial reporting and a common set of desired qualitative characteristics. These were presented in the Chapter 2 discussion. ๏‚ง ๏‚ง ๏‚ง ๏‚ง ๏‚ง ๏‚ง ๏‚ง ๏‚ง 2-12 Kimmel, Accounting, 5/e, Instructorโ€™s Manual ๏‚ง ๏‚ง The monetary unit assumption is part of each framework. However, the unit of measure will vary depending on the currency used in the country in which the company is incorporated (e.g., Chinese yuan, Japanese yen, and British pound). The economic entity assumption is also part of each framework although some cultural differences result in differences in its application. For example, in Japan many companies have formed alliances that are so strong that they act similar to related corporate divisions although they are not actually part of the same company. ๏‚จ LOOKING TO THE FUTURE The IASB and the FASB are working on a project to converge their standards related to financial statement presentation. A key feature of the proposed framework is that each of the statements will be organized in the same format, to separate an entityโ€™s financing activities from its operating and investing activities and, further, to separate financing activities into transactions with owners and creditors. Thus, the same classifications used in the statement of financial position would also be used in the income statement and the statement of cash flows. The project has three phases. You can follow the joint financial presentation project at the following link: http://www.fasb.org/project/financial_statement_presentation.shtml. The IASB and the FASB face a difficult task in attempting to update, modify, and complete a converged conceptual framework. For example, how do companies choose between information that is highly relevant but difficult to verify versus information that is less relevant but easy to verify? How do companies define control when developing a definition of an asset? Is a liability the future sacrifice itself or the obligation to make the sacrifice? Should a single measurement method, such as historical cost or fair value, be used, or does it depend on whether it is an asset or liability that is being measured? It appears that the new document will be a significant improvement over its predecessors and will lead to principle-based standards, which will help financial statement users make better decisions. Kimmel, Accounting, 5/e, Instructorโ€™s Manual 2-13 Chapter 2 Review Identify sections of a classified balance sheet. Explain the differences between current and long-term assets and liabilities. Identify accounts that fit into each section. What is measured by profitability ratios? Compute EPS and discuss how it is used to measure profitability. What is the relationship between a retained earnings statement and a statement of stockholdersโ€™ equity? Which contains the most information? Define liquidity and solvency. Identify and compute ratios for analyzing a firmโ€™s liquidity and solvency. How are these ratios interpreted? Use the statement of cash flows to evaluate solvency. Compute free cash flow and describe what it measures. What are generally accepted accounting principles? Name the U.S. and international standardsetting bodies that establish these principles. Define and explain the significance of relevance, faithful representation, comparability, and consistency. Define and explain assumptions and principles that are used in financial reporting. Define and explain cost constraint. 2-14 Kimmel, Accounting, 5/e, Instructorโ€™s Manual Vocabulary Quiz Name _______________ Chapter 2 1. Assets of a relatively permanent nature that are being used in the business and are not intended for resale. 2. The quality of information that indicates the information makes a difference in a decision. 3. A measure used to evaluate a companyโ€™s liquidity and short-term debt-paying ability, computed by dividing current assets by current liabilities. 4. A financial statement that presents the factors that caused stockholdersโ€™ equity to change during the period, including those things that caused retained earnings to change. 5. The constraint of determining whether an item is large enough to likely influence the decision of an investor or creditor. 6. An assumption that economic events can be identified with a particular unit of accountability. 7. Obligations that companies reasonably expected to pay within the next year or operating cycle, whichever is longer. 8. Use of the same accounting principles and methods from year to year within a company. 9. Cash provided by operating activities adjusted expenditures and dividends paid. 10. An accounting principle that states that companies should record assets at their cost. Kimmel, Accounting, 5/e, Instructorโ€™s Manual for capital 2-15 Solutions to Vocabulary Quiz Chapter 2 1. Property, plant, and equipment, or fixed assets, or plant assets 2. Relevance 3. Current ratio 4. Statement of stockholdersโ€™ equity 5. Materiality 6. Economic entity assumption 7. Current liabilities 8. Consistency 9. Free cash flow 10 . 2-16 Cost principle or historical cost principle Kimmel, Accounting, 5/e, Instructorโ€™s Manual Multiple Choice Name _______________ Chapter 2 1. Earnings per share is: a. a measure of liquidity. b. most meaningful when used to analyze the performance of different companies. c. a measure of net income earned on each share of common stock. d. determines the amount of dividends that a company pays. 2. Which of the characteristics is not necessary in order for accounting information to provide faithful representation? a. conservative. b. free from error. c. complete. d. neutral. 3. Consistency of information means that: a. the information would influence a decision. b. different companies use the same accounting principles. c. the amounts involved are material. d. a company uses the same accounting principles and methods from year to year. 4. Comparability of information results when: a. b. c. d. the information would influence a decision. different companies use the same accounting principles. the amounts involved are material. a company uses the same accounting principles and methods from year to year. 5. The periodicity assumption: a. indicates that the company will continue in operation long enough to carry out its existing objectives. b. requires that financial statements be prepared each month. c. states that the life of a business can be divided into artificial time periods. d. is an example of a constraint. 6. Current liabilities include: a. obligations to be paid within the coming year. b. accounts payable. c. wages payable. d. all of these answer choices are correct. 7. Working capital is: a. current assets less current liabilities. b. current assets divided by current liabilities. c. income divided by average assets. d. net income divided by net sales. Kimmel, Accounting, 5/e, Instructorโ€™s Manual 2-17 8. All of the following are current assets except: a. accounts receivable. b. cash. c. patents. d. marketable securities. 9. The current ratio is a: a. solvency ratio. b. profitability ratio. c. liquidity ratio. d. none of these answer choices are correct. 10. Free cash flow: a. describes an unlimited supply of cash. b. provides additional insight regarding a companyโ€™s cash-generating ability. c. describes the cash remaining from operations after adjusting for capital expenditures and dividends. d. Both provides additional insight regarding a companyโ€™s cash-generating ability and describes the cash remaining from operations after adjusting for capital expenditures and dividends. 2-18 Kimmel, Accounting, 5/e, Instructorโ€™s Manual Solutions to Multiple Choice Chapter 2 1. c 2. a 3. d 4. b 5. c 6. d 7. a 8. c 9. c 10. d Kimmel, Accounting, 5/e, Instructorโ€™s Manual 2-19 Exercise 1 – Research and Communication Activity Chapter 2 Blaire and Mark married last year and immediately opened a small computer business. Blaire is responsible for managing the business while Mark is responsible for the accounting. At the end of each month, Mark tells Blaire that the business is earning a profit. Blaire, however, is very frustrated and skeptical. She calls the bank periodically and much to her amazement, the business has no more money in the checking account than it did on the opening day. Blaire and Mark heard that you were taking an accounting course at a local university and have come to you, a friend, for help. Write a memo to the young entrepreneurs explaining how it is indeed possible to have a net income and not have an increase in cash. Solution: DATE: 9/5/201X TO: Blaire and Mark FROM: Accounting Student Net income and cash flow are totally different. Therefore, it is quite possible for a business to have a significant amount of net income and no increase in cash. Think about the transactions of your business during the past year. Has inventory increased? Have you purchased additional equipment, furniture, or fixtures? Did you withdraw money from the business. All of the aforementioned transactions, while necessary, decrease cash. However, if you have added inventory, equipment, furniture, and/or fixtures, you have increased assets other than cash. Therefore your business is worth more than it was at the onset. 2-20 Kimmel, Accounting, 5/e, Instructorโ€™s Manual Exercise 2 โ€“ Financial Statement Analysis and Decision Making Activity Chapter 2 Select two competing companies (i.e. Fordโ€”GM, Eli Lillyโ€”Merck, Ben & Jerryโ€™sโ€”Edyโ€™s), and locate annual reports for these companies on the internet. These companies can be found on the Internet at http://www.ford.com, http://www.gm.com, http://www.elililly.com, http://www.merck.com, http://www.benjerry.com, and http://www.edys.com. 1. Compute the current ratio, debt to total assets ratio, and free cash flow for the companies you have selected. Discuss your findings. 2. Which company would you recommend as an investment? 3. Why did you answer Question 2 as you did? Have you considered the issues presented in the Decision Toolkits in Chapter 2? Explain how this affected your recommendation. Solutions: Information available on website. Note: The website is constantly being updated. Please check to see that the information requested in this exercise is available. Kimmel, Accounting, 5/e, Instructorโ€™s Manual 2-21 Exercise 3 – Ratio Analysis and Creative Activity Chapter 2 Refer to the loan application prepared for your fictitious business in Campus Town USA in Exercise 3 of Chapter 1 in answering the following questions: 1. Compute the current ratio and debt to total assets ratio for your fictitious company. 2. Would you like to amend the financial statements prepared in chapter 1? Additional loan application forms are provided for your convenience. 2-22 Kimmel, Accounting, 5/e, Instructorโ€™s Manual Exercise 3 – Ratio Analysis and Creative Activity (Continued) Chapter 2 LOAN APPLICATION FORM Name of Company Address Phone Number Annual Income Revenues Cost of goods sold Operating expenses Rent Utilities Wages Advertising Other Net income (loss) Assets Cash Accounts receivable Inventory Property, plant, & equipment Other Total assets Liabilities Accounts payable Notes payable Other Total liabilities Stockholdersโ€™ Equity Total stockholdersโ€™ equity Total liabilities & stockholdersโ€™ equity Kimmel, Accounting, 5/e, Instructorโ€™s Manual 2-23 Exercise 4 – Financial Statements and Creative Activity Chapter 2 1. Prepare personal financial statements, including an income statement and a balance sheet. Remember to include all of your sources of revenues; income from jobs, allowance from parents, etc. In addition, please consider all of your assets, clothes, jewelry, automobiles, electronic equipment, etc. 2. Keep a record of your income and expenses for a month. 3. At the end of the month, prepare financial statements, including an income statement, balance sheet, and a statement of cash flows. 2-24 Kimmel, Accounting, 5/e, Instructorโ€™s Manual Exercise 5 – Financial Statements and Creative Activity Chapter 2 The Ice Cats, a professional ice hockey team moved to College Town USA. Joe Enterprise, organized Joeโ€™s Tees to take advantage of the large number of fans the team attracted by selling tee shirts with the teamโ€™s name and logo printed in the teamโ€™s colors. Joe sold the shirts from a cart in front of the arena where the Ice Cats perform. Joe bought the cart for $5,000. Joe anticipates the cart will last for five years. The shirts cost $14 and Joe sold them for $25. In addition, Joe is required to buy a city license for $125. During the first season, there were 10 home games at which Joe averaged selling 32 shirts a game. Compute Joeโ€™s net income or net (loss). Solution: Revenues Less expenses: Cost of shirts Cart License Net loss $8,000 $4,480 5,000* 125 9,605 ($1,605) *Most students are not yet familiar with accrual accounting or the concept of depreciation. You may want to keep a copy of the studentsโ€™ work. This exercise will be revisited in a later chapter. Kimmel, Accounting, 5/e, Instructorโ€™s Manual 2-25 Exercise 6 – World Wide Web Research, Financial Statement Analysis, and International Activity Chapter 2 Select two competing companies, one a domestic company, the other a foreign company (i.e. Nikeโ€”Fila and ExxonMobilโ€”BP), and locate annual reports for these companies on the internet. These companies can be found at http://www.nike.com, http://www.fila.com, http://www.exxon.com, and http://www.bp.com. 1. Where are the headquarters for the two companies you selected? 2. In what currency are the financial statements of the foreign company stated? 3. How are the financial statements similar? How are the financial statements different? Solutions: Information available on website. Note: The website is constantly being updated. Please check to see that the information requested in this exercise is available. 2-26 Kimmel, Accounting, 5/e, Instructorโ€™s Manual Exercise 7 โ€“ Accounting Career Activity Chapter 2 Public accounting is one of the largest sectors of the accounting field. In order to retain a job in public accounting, one must become a Certified Public Accountant (CPA). An accountant may be designated a CPA only after he or she has passed a uniform exam and has met the experience requirements of the state in which they are certified. The American Institute of Certified Public Accountants is responsible for administering the CPA exam. Visit the AICPA at http://www.aicpa.org and click on Students to find answers to the following questions. 1. What is a CPA? What are the requirements to become a CPA? 2. What are the recommended areas of study to become a CPA? 3. What skills are needed to become a successful accountant/CPA? 4. What are the different career paths in accounting? Solutions: Information available on website. Note: The website is constantly being updated. Please check to see that the information requested in this exercise is available. Kimmel, Accounting, 5/e, Instructorโ€™s Manual 2-27 Exercise 8 – World Wide Web Financial Research Activity Chapter 2 Johnson & Johnson is an international company committed to social responsibility. Visit Johnson & Johnson at http://www.johnsonjohnson.com and click on our Company and Our Credo values. 1. Provide a brief summary outlining Johnson & Johnsonโ€™s executivesโ€™ position on social responsibility. 2. List specific examples of social programs in which Johnson & Johnson is involved. Solutions: Information available on website. Note: The website is constantly being updated. Please check to see that the information requested in this exercise is available. 2-28 Kimmel, Accounting, 5/e, Instructorโ€™s Manual

Document Preview (132 of 326 Pages)

User generated content is uploaded by users for the purposes of learning and should be used following SchloarOn's honor code & terms of service.
You are viewing preview pages of the document. Purchase to get full access instantly.

Shop by Category See All


Shopping Cart (0)

Your bag is empty

Don't miss out on great deals! Start shopping or Sign in to view products added.

Shop What's New Sign in