Solution Manual for Elementary Survey Sampling, 7th Edition

Preview Extract
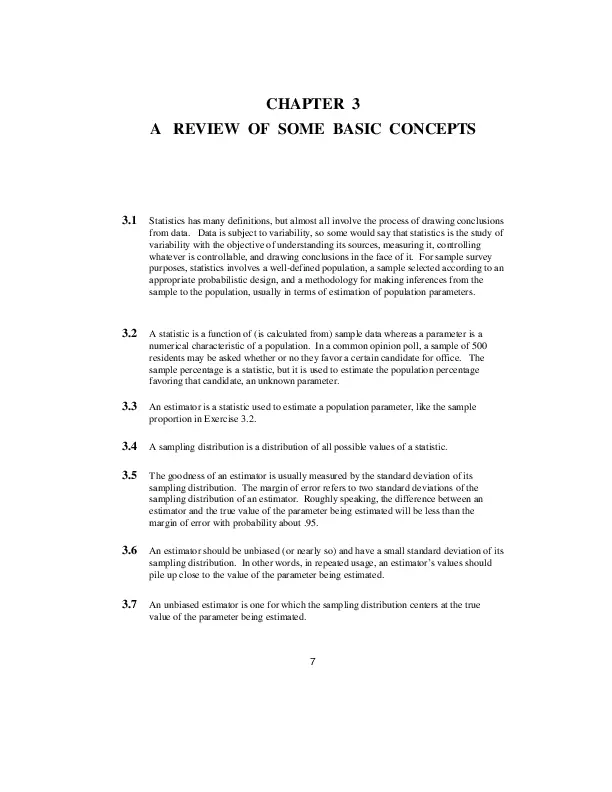
CHAPTER 3 A REVIEW OF SOME BASIC CONCEPTS 3.1 Statistics has many definitions, but almost all involve the process of drawing conclusions from data. Data is subject to variability, so some would say that statistics is the study of variability with the objective of understanding its sources, measuring it, controlling whatever is controllable, and drawing conclusions in the face of it. For sample survey purposes, statistics involves a well-defined population, a sample selected according to an appropriate probabilistic design, and a methodology for making inferences from the sample to the population, usually in terms of estimation of population parameters. 3.2 A statistic is a function of (is calculated from) sample data whereas a parameter is a numerical characteristic of a population. In a common opinion poll, a sample of 500 residents may be asked whether or no they favor a certain candidate for office. The sample percentage is a statistic, but it is used to estimate the population percentage favoring that candidate, an unknown parameter. 3.3 An estimator is a statistic used to estimate a population parameter, like the sample proportion in Exercise 3.2. 3.4 A sampling distribution is a distribution of all possible values of a statistic. 3.5 The goodness of an estimator is usually measured by the standard deviation of its sampling distribution. The margin of error refers to two standard deviations of the sampling distribution of an estimator. Roughly speaking, the difference between an estimator and the true value of the parameter being estimated will be less than the margin of error with probability about .95. 3.6 An estimator should be unbiased (or nearly so) and have a small standard deviation of its sampling distribution. In other words, in repeated usage, an estimatorโ€™s values should pile up close to the value of the parameter being estimated. 3.7 An unbiased estimator is one for which the sampling distribution centers at the true value of the parameter being estimated. 7 3.8 3.10 The error of estimation refers to the difference between an estimator and the true value of a parameter being estimated. It is measured by the standard deviation of the sampling distribution of the estimator in question. Summary Statistics Calories Cost in Dollars w/Hydra w/o Hydra w/ Hydra w/o Hydra Mean 64.78 64.62 .294 .27 Median 66.0 63.5 .260 .25 Stdev 8.51 9.09 .097 .05 60 60 .230 .225 Q1 70 70 .345 .320 Q3 Min 50 50 .220 .220 Max 80 80 .520 .350 Range 30 30 .300 .130 Scatterplot of cost vs. calories 0.50+ cost 0.40+ 0.30+ 0.20+ * Hydra * * * * * * 2 +———+———+———+———+———+—–calories 48.0 54.0 60.0 66.0 72.0 78.0 8 Scatterplot of cost vs. calories (without Hydra) 0.350+ * * cost 0.300+ * * 0.250+ * * 2 0.200+ +———+———+———+———+———+—–calories 48.0 54.0 60.0 66.0 72.0 78.0 (a) The mean is a good summary number for typical calories per serving. The standard deviation is a good summary number for the variation in the calories. Box plot of calories ———————————-I + I——————————–+———+———+———+———+———+—–48.0 54.0 60.0 66.0 72.0 78.0 (b) Since there is an extreme value, the median is a good summary number for typical cost per serving, and IQR (Q3 – Q1) is a good summary for the variation in costs. Box plot of cost —————–Hydra —I + I* ———————–+———+———+———+———+———+ 0.240 0.300 0.360 0.420 0.480 0.540 (c) Because these drinks would not generally be combined by users, the totals have little practical value here. (d) On the average calories per serving; not much impact On the standard deviation: slight increase On the average cost per serving: decrease 9 On the standard deviation of the cost per serving: decreased Box plot of calories (without Hydra) ———————————-I + I——————————–+———+———+———+———+———+—–48.0 54.0 60.0 66.0 72.0 78.0 Box plot of cost (without Hydra) ——————————–I + I—————————————————+———+———+———+———+———+-0.225 0.250 0.275 0.300 0.325 0.350 3.11 (e) There is no particularly influential drink on the average calories per saving, but Snappple (80 calories) has the most influence as it is furthest from the mean. (a) Including the powdered drinks on the same list with the liquid drinks does not have much effect on the average calories per serving, as their calorie figures are within the range of the first data set. Including the powdered drinks lowers the average cost per serving and increases the standard deviation of cost because the new cost values are much lower than in the original set. w/o powder w powder calories mean stdev 64.78 8.51 64.82 7.93 cost mean .294 .278 stdev .097 .102 Parallel box plots of calories w/o powder ———————————-I + I——————————— ———————————-I + I——————————–+———+———+———+———+———+—–48.0 54.0 60.0 66.0 72.0 78.0 w/ powder 10 Parallel box plots of cost —————I + I————– w/o powder w/ powder (b) * ————————I + I—-* ——————+———+———+———+———+——-0.160 0.240 0.320 0.400 0.480 Adding the light varieties to the list will not have much of an effect on the average cost and standard deviation of cost. Mean and standard deviation for two groups (cost) w/o lites w/ lites mean .294 .286 stdev .097 .088 Parallel box plots of cost w/o lites w/ lites (c) ——————–I + I—————— * ————-I + I——-O —————-+———+———+———+———+———+ 0.240 0.300 0.360 0.420 0.480 0.540 Adding the light varieties to the list will decrease the average calories per serving and increase the standard deviation of calories because the new cost figures are way below those of the original data set. Mean and standard deviation for two groups (calories) w/o lites w/ lites mean 64.78 55.45 stdev 8.51 22.69 11 Parallel box plots of calories ————–I + I————- w/o lites w/ lites (d) 3.12 ————-I + I—————+———+———+———+———+———+—–0 15 30 45 60 75 O * Use the median because the median is not sensitive to extreme values. Summary Statistics Area U.S U.S.& Foreign (a) N 10 10 mean 25.10 4.80 median 12.50 1.00 stdev Q1 22.02 7.50 7.18 0.00 Q3 51.25 10.00 Q3 – Q1 43.75 10.00 As shown on the stem plot, these data are split into two groups and neither the mean nor the median are good measures of center. A more meaningful summary statistic is the total number of endangered species, 251 for those unique to the U.S. and 299 in the U.S. and foreign countries. Box plot of U.S. ———————————————–I + I——————————————————–+———+———+———+———+——-10 20 30 40 50 Stem plot of U.S. Stem-and-leaf of US Leaf Unit = 1.0 3 (3) 4 4 3 3 (b) 0 368 1 023 2 3 7 4 5 057 Again, the total number of endangered species is a more meaningful statistic than either the mean or median. For the world, this total is 791 species. 12 Stem plot of U.S & Foreign Stem-and-leaf of US & Foreign Leaf Unit = 1.0 5 5 3 3 3 2 2 2 2 1 0 00000 0 23 0 0 0 8 1 1 1 1 6 1 9 Box plot of U.S. & Foreign ———————–I + I—————————————————–+———+———+———+———+———+—–0.0 3.5 7.0 10.5 14.0 17.5 3.13 (c) No. See part (a). (a) 58 1 (3 ร— 16 + 2 ร— 4 + 1 ร— 2) = = 2.32 25 25 (b) ยต = โˆ‘ xp( x ) = 3ร—.64 + 2ร—.16 + 1ร—.08 + 0ร—.12 = 2.32 (c) V ( x ) = โˆ‘ ( x โˆ’ ยต ) 2 p( x ) = โˆ‘ x 2 p( x ) โˆ’ ยต 2 x x = 3 2 (.64) + 2 2 (.16) + 12 (.08) + 0 2 (.12) โˆ’ 2.32 2 = 6.48 โˆ’ 5.3824 = 10976 . ฯƒ = V ( x ) = 105 . 3.14 (a) ยต = E ( x ) = โˆ‘ xp( x ) = 2(.443) + 3(.229) + 4(.200) + 5(.086) + 6(.028) + 7(.014) = 3.069 (b) ฯƒ 2 = V( x) = โˆ‘ ( x โˆ’ ยต ) p(x) = 1.458 2 x ฯƒ = V(x) = 1.207 13 (c) (d) 3.15 The distribution of the sample data would reflect that of the population. Most of the data values would pile up around 2 and 3 , with a few larger values. The distribution of the sample would be skewed toward the larger values, with a center at approximately 3.07 and a standard deviation of approximately 1.21. The sample mean x has approximately a normal distribution with mean ฯƒ 1.21 ยตx = ยตx = 3.07 and standard deviation ฯƒ x = = = 0.0605 n 20 (a) The scatter plot shows that SAT and Percent are negatively correlated, with a curved pattern suggesting that the average score drops quickly as the percentages begin to increase and them levels off for higher percentages. The decreasing scores with increasing percentage taking the exam makes practical sense; in states with small percentages only the very best students are taking the exam. (b) The correlation coefficient is -0.877, but this is not a good measure to use here because of the curvature in the patter. Correlation measures the strength of a linear relationship between two variables. Scatter plot between Average Score and Percent x 1200 xx x xx xx x x x x x x x x x x x x Aver age x xx x 1050 x x x x x x x x xx x x x x x 2 x xxx x x x x x x 0 3.16 20 40 60 80 Tabled below are the new probabilities for samples of size 2 and estimates of the population total for the unequal probabilities of selection that favor the smaller population values. 14 Per cent Sample Probability ฯ„ห† pps {1.2} {1.3} {1.4} {2,3} {2,4} {3,4} {1,1} {2.2} {3,3} {4,4} 0.32 0.08 0.08 0.08 0.08 0.02 0.16 0.16 0.01 0.01 3.75 16.25 21.25 17.50 22.50 35.00 2.50 5.00 30.00 40.00 Calculation of expectations yields: E ฯ„ห† pps = 10 ( ) V (ฯ„ห† pps) = 81.25 3.17 The weights given in Section 3.3 for the four population values are w1 = 4.0916, w2 = 4.0916, w3 = 1.3236 and w4=1.3236. The sum of the weights for each of the six possible samples, along with the probabilities of selecting each of these samples, are shown in the accompanying table. The expected value of the sum of the weights turns out to be 4.00, the number of values in the population. Sample 3.18 Sum of weights {1,2} 8.1832 {1,3} {1,4} {2,3} {2,4} {3,4} 5.4152 5.4152 5.4152 5.4152 2.6472 Probability of sample, unequal weights .0222 .1111 .1111 .1111 .1111 .5333 For samples of size n=2 taken with probabilities proportional to the populations of the states, the pertinent data and the probabilities of selection with probabilities proportional to the population, both with and without replacement, are given in the first table that follows. With replacement probabilities of selection (ฮด) are directly proportional to the population sizes. Without replacement probabilities of selection (ฯ€) are found by first finding the probability for each possible sample, given on the 15 second table. Note that there are 21 with replacement samples of size 2, but only 15 without replacement samples. (Also, note that the ฯ€โ€™s sum to 2, the sample size.) Students Teachers Population 570 206 973 207 158 101 42 17 69 15 11 8 35 13 64 13 11 6 With Replacement Probability of selection, ฮด 0.25 0.09 0.45 0.09 0.08 0.04 Without Replacement Probability of selection,ฯ€ 0.536150 0.214110 0.746890 0.214110 0.191280 0.097451 The estimates of the total number of teachers are found by using the formulas of Section 3.3. The expected value of each set of estimates, with their appropriate probability distributions, is 162, the total number of teachers for New England. 3.19 Sample Probability (with replacement) Estimate (with replacement) Probability (without replacement) Estimate (without replacement) {1.2} {1,3} {1,4} {1,5} {1,6} {2,3} {2,4} {2,5} {2,6} {3.4} {3,5} {3,6} (4,5} {4,6} {5,6} {1,1} {2,2} {3,3} {4,4} {5,5} {6,6} 0.0450 0.2250 0.0450 0.0400 0.0200 0.0810 0.0162 0.0144 0.0072 0.0810 0.0720 0.0360 0.0144 0.0072 0.0064 0.0625 0.0081 0.2025 0.0081 0.0064 0.0016 178.444 160.667 167.333 152.750 184.000 171.111 177.778 163.195 194.445 160.000 145.417 176.667 152.083 183.333 168.750 168.000 188.889 153.333 166.667 137.500 200.000 0.054725 0.354545 0.054725 0.048406 0.023750 0.118142 0.017802 0.015738 0.007706 0.118142 0.104585 0.051477 0.015738 0.007706 0.006812 157.735 170.719 148.394 135.844 160.429 171.781 149.456 136.906 161.491 162.441 149.890 174.476 127.565 152.150 139.600 No; the proportions of students in the various states are about the same as the proportions of the total population. 16 3.20 A histogram of 200 sample means from samples of size 5 each are shown in the histogram. This distribution is somewhat skewed because the population distribution of teachers per state is highly skewed. Even so, the mean of the sampling distribution is 61, 147, quite close to the population mean of 59,856. The standard deviation of the sampling distribution is 26,772, quite close to the theoretical value of 28,645. Histogram Means f rom samples of 5 40 35 30 25 20 15 10 5 0 40000 80000 120000 160000 Mean 3.21 p(u1 ) = p(u 2 ) = โ‹… โ‹… โ‹… = p(u N ) = 1 / N ฯƒ 2 = V ( y ) = E ( y โˆ’ ยต ) 2 = โˆ‘ ( y โˆ’ ยต ) 2 p( y ) = y 3.22 1 N โˆ‘ ( ui โˆ’ ยต ) 2 N i =1 Let ai denote the number of times a particular yi value from the population appears in the sample. This number could be greater than 1 because the sampling is with replacement. Then, N n y yi 1 1 ai i = ฯ„ห† = ฮดi ฮดi n n โˆ‘ โˆ‘ i =1 i=1 where n is the sample size and N the population size. Since E(ai ) = nฮดi , it follows that E(ฯ„ห† )= ฯ„ . Now, ฯ„ห† is the mean of n independent variables, and so its variance is given by V (ฯ„ห† )= 1 n N โˆ‘ ๏ฃซy ๏ฃถ ฮดi ๏ฃฌ i โˆ’ ฯ„ ๏ฃท ๏ฃญฮดi ๏ฃธ i =1 17 2 The estimate of this variance can be rewritten as follows: n โˆ‘ y ห† (ฯ„ห†) = 1 โ‹… 1 V ( i โˆ’ ฯ„ห† ) 2 n n โˆ’ 1 i =1 ฮด i n = โˆ‘ 1 1 y โ‹… [( i โˆ’ ฯ„ ) โˆ’ (ฯ„ห† โˆ’ ฯ„ )] 2 n n โˆ’ 1 i =1 ฮดi n โˆ‘ 1 1 y = โ‹… [ ( i โˆ’ ฯ„)2 โˆ’ n n โˆ’ 1 i =1 ฮดi N = n โˆ‘ (ฯ„ห† โˆ’ ฯ„ ) ] 2 i=1 N 1 1 y โ‹… [ ai ( i โˆ’ ฯ„ )2 โˆ’ ai (ฯ„ห† โˆ’ ฯ„ ) 2 ] n n โˆ’ 1 i =1 ฮด i โˆ‘ โˆ‘ i =1 N = โˆ‘ 1 y 1 โ‹… [ ai ( i โˆ’ ฯ„ )2 โˆ’ n(ฯ„ห† โˆ’ ฯ„ ) 2 ] n n โˆ’ 1 i =1 ฮด i Taking expected values shows that: ห† (ฯ„ห† )] = E[ V = 3.23 N 1 1 y โ‹… [ nฮด i ( i โˆ’ ฯ„ ) 2 โˆ’ nE(ฯ„ห† โˆ’ ฯ„ ) 2 ] n n โˆ’ 1 i =1 ฮดi โˆ‘ 1 1 โ‹… [n 2 V (ฯ„ห†) โˆ’ nV (ฯ„ห† )] = V (ฯ„ห† ) n n โˆ’1 Aspirin Placebo Exercise Vigorously Yes No Total 7 910 2997 10907 7861 3060 10921 Cigarette smoking Never Past Current Total 5431 4373 1213 11017 5488 4301 1225 11014 (a) Compare the two columns we see that the counts are nearly the same across all categories. The randomization scheme did a good job in balancing these variables between the two groups. (b) No. (c) 5431 =.49, 11017 2997 No. =.27, 10907 5488 =.50 are nearly the same. 11014 3060 =.28 are nearly the same. 10921 18 3.24 Heart Attack Yes No Total Yes, 3.25 No, Aspirin 139 10861 11000 139 =.012636 11000 Placebo 239 10761 11000 239 =.021727 are not close. 10682 Stroke Yes No Total Aspirin 119 10881 11000 Placebo 98 10902 11000 119 =.0108 11000 98 =.0089 are close. 11000 .021727 .0089 = 172 =.82 , we can find Aspirin is more . , .012636 .0108 effective as a possible prevention for heart attacks than for strokes. Comparing the two ratios 3.26 The rate of heart attacks for the smokers (21/1213 = 0.0173) is greater than the rate for those who never smoked (55/5431 = 0.0101), but the effectiveness of the aspirin is about the same for both groups. One way to demonstrate the latter is to look at the ratio of the heart attack rates for aspirin and placebo treatments, as shown here. 21 / 1213 = .573, 37 / 1225 55 / 5431 = .579 96 / 5488 19

Document Preview (13 of 149 Pages)

User generated content is uploaded by users for the purposes of learning and should be used following SchloarOn's honor code & terms of service.
You are viewing preview pages of the document. Purchase to get full access instantly.

Shop by Category See All


Shopping Cart (0)

Your bag is empty

Don't miss out on great deals! Start shopping or Sign in to view products added.

Shop What's New Sign in